Exam 5: Exploring Data With Graphs
Exam 1: Why Is My Evil Lecturer Forcing Me to Learn Statistics9 Questions
Exam 2: The Spine of Statistics25 Questions
Exam 3: The Phoenix of Statistics16 Questions
Exam 4: The Ibm Spss Statistics Environment25 Questions
Exam 5: Exploring Data With Graphs12 Questions
Exam 6: The Beast of Bias23 Questions
Exam 7: Non-Parametric Models20 Questions
Exam 8: Correlation23 Questions
Exam 9: The Linear Model Regression20 Questions
Exam 10: Comparing Two Means25 Questions
Exam 11: Moderation, Mediation and Multicategory Predictors16 Questions
Exam 12: Glm 1: Comparing Several Independent Means22 Questions
Exam 13: Glm 2: Comparing Means Adjusted for Other Predictors Analysis of Covariance25 Questions
Exam 14: Glm 3: Factorial Designs25 Questions
Exam 15: Glm 4: Repeated-Measures Designs24 Questions
Exam 16: Glm 5: Mixed Designs17 Questions
Exam 17: Multivariate Analysis of Variance Manova19 Questions
Exam 18: Exploratory Factor Analysis22 Questions
Exam 19: Categorical Outcomes: Chi-Square and Loglinear Analysis24 Questions
Exam 20: Categorical Outcomes: Logistic Regression24 Questions
Exam 21: Multilevel Linear Models9 Questions
Select questions type
What could be done to make the information in this graph more clear? 
Free
(Multiple Choice)
4.8/5  (41)
(41)
Correct Answer: Verified
B
What conclusion can be drawn from the data provided in the figure below in relation to sleep and cigarette smoking? 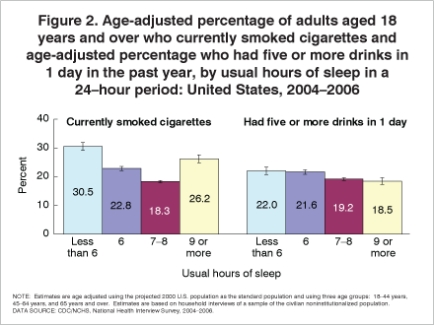
Free
(Multiple Choice)
4.8/5 (33)
Correct Answer:Verified
D
For which of the following sets of variables would you not use a scatterplot in order to show your data?
Free
(Multiple Choice)
4.8/5 (43)
Correct Answer:Verified
D
I collected some data about how much buyers of my book liked it (on a scale of 1 = it's utter rubbish to 10 = I never read anything else). I ended up with a sample of 15,467 people. When I looked at the distribution, I found a skew of 1.23 (SE = 0.65). The mean rating was 4.78. What is the z-score for the skew of my data?
(Multiple Choice)
4.8/5 (33)
What does the information in the following boxplot tell you about the surviving infants of severe idiopathic respiratory distress syndrome? 
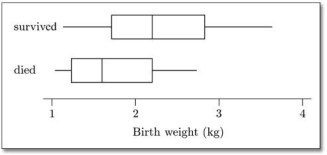 Birthweights of infants with severe idiopathic respiratory distress syndrome (SIRDS)
(Multiple Choice)
4.8/5 (37)
The following figure is drawn from Schoenborn, C. A. and Adams, P. F. (2008, May). Sleep duration as a correlate of smoking, alcohol use, leisure-time physical inactivity, and obesity among adults: United States, 2004-2006. Hyattsville, MD: National Center for Health Statistics. It is available via HYPERLINK "http://www.cdc.gov/nchs" http://www.cdc.gov/nchs. What type of bar charts are shown in the figure? 
(Multiple Choice)
4.8/5 (31)
What does this graph tell you about those who had five or more drinks in one day? 
(Multiple Choice)
4.8/5 (33)
Which of the following is not recommended when displaying information graphically?
(Multiple Choice)
4.8/5 (35)
What statement best describes what is shown in the graph below? 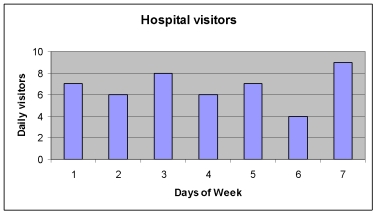
(Multiple Choice)
4.9/5 (38)
Filters
- Essay(0)
- Multiple Choice(0)
- Short Answer(0)
- True False(0)
- Matching(0)