Deck 13: Population Dynamics Over Space and Time
Full screen (f)
Question
Use the following figure to answers questions 16 to 18:
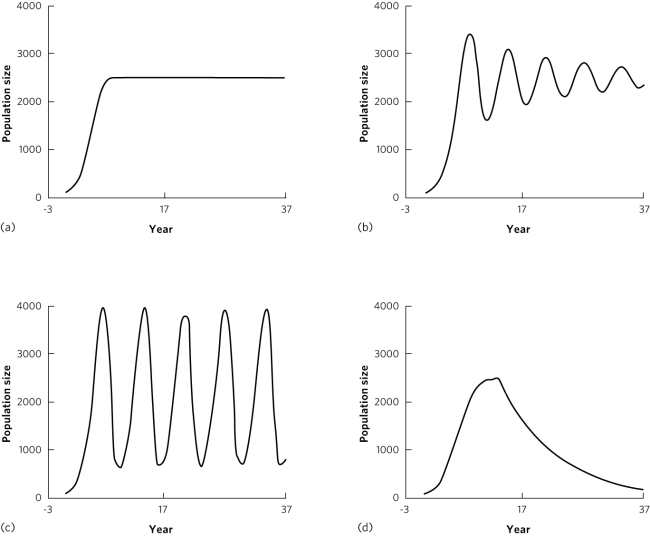
Which panel is most likely to indicate a population with a constant environment and no time delays in density dependence?
A) a
B) b
C) c
D) d
Which panel is most likely to indicate a population with a constant environment and no time delays in density dependence?
A) a
B) b
C) c
D) d
Question
Use the following figure to answers questions 16 to 18:
Which panel illustrates a population growing under a logistic model with time delays of 2 years, intrinsic rate of population increase of 0.5, and carrying capacity of 250 individuals?
A) a
B) b
C) c
D) d
Which panel illustrates a population growing under a logistic model with time delays of 2 years, intrinsic rate of population increase of 0.5, and carrying capacity of 250 individuals?
A) a
B) b
C) c
D) d
Question
Question
Question
 Which conclusion does the figure support?
A) Recruitment of all species has been constant.
B) Oak may have had increased recruitment since 1650.
C) White pine may have had decreased recruitment since 1650.
D) Eastern hemlock has had decreased recruitment since 1650.
Question
Question
Question
Question
Question
Question
Question
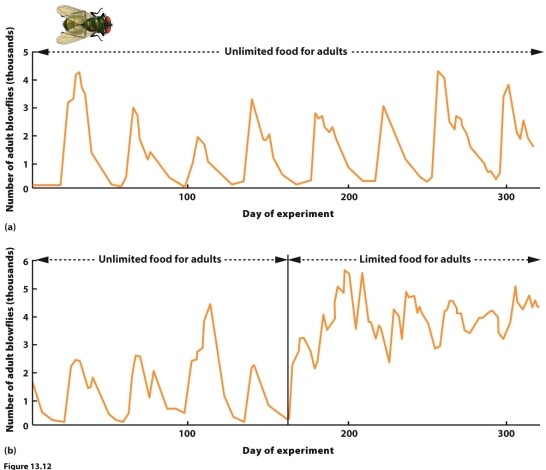
 Based on the figure, which year produced an unusually high number of offspring?
A) 1942
B) 1943
C) 1944
D) 1945
E) 1946
Question
Question
 A herd of 25 caribou was introduced to St. Paul Island in 1911. The line shows the number of caribou on the island. Which describe(s) the entire figure correctly?
I) The pattern fits the exponential model of population growth.
II) The population experienced an overshoot.
III) The population experienced a die-off.
A) I only
B) II only
C) III only
D) II and III only
E) I, II, and III
Question
Question
Question
Use the following figure to answers questions 16 to 18:
Which panel illustrates a stable limit cycle?
A) a
B) b
C) c
D) d
Which panel illustrates a stable limit cycle?
A) a
B) b
C) c
D) d
Question
Question
Question
Question
Question
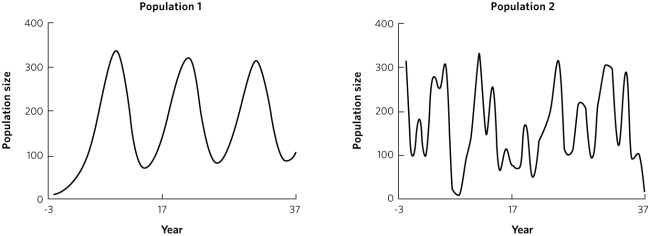
Consider these two populations, which exhibit variation in population size over time. In which population is the fluctuation most likely due to environmental variation, and in which population is fluctuation most likely due to density dependence? Explain your answer.
Question
Question
Question
Question
Question
. 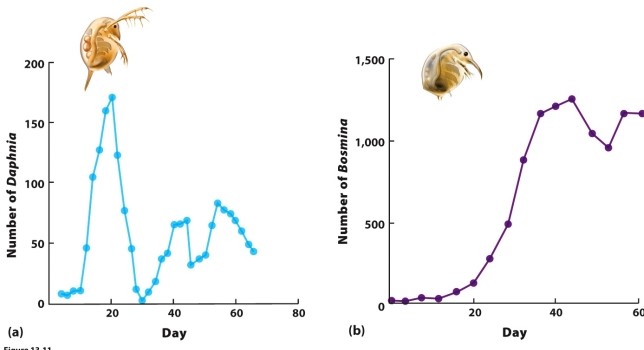 Which of the following is MOST likely to explain why Daphnia exhibits greater oscillations in population size than Bosmina?
A) Daphnia exhibits delayed density dependence; Bosmina does not.
B) Bosmina exhibits delayed density dependence; Daphnia does not.
C) Daphnia's carrying capacity is higher than Bosmina's.
D) Daphnia's carrying capacity is lower than Bosmina's.
Which of the following is MOST likely to explain why Daphnia exhibits greater oscillations in population size than Bosmina?A) Daphnia exhibits delayed density dependence; Bosmina does not.
B) Bosmina exhibits delayed density dependence; Daphnia does not.
C) Daphnia's carrying capacity is higher than Bosmina's.
D) Daphnia's carrying capacity is lower than Bosmina's.
Question
Question
Question
Question
Question
Question
Question
Question
Question
Question
Question
Question
Question
Question
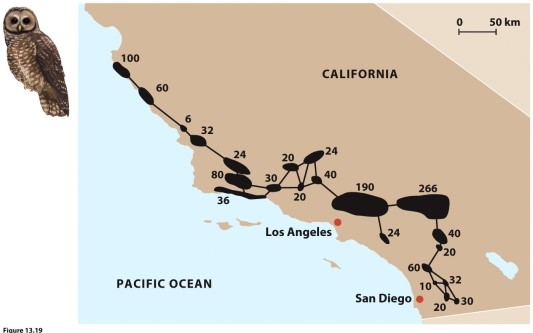
This figure shows a metapopulation for the California spotted owl. Describe two ways in which this real metapopulation differs from the assumptions of the basic model of metapopulation dynamics, = (1 − e/c).
Question
Question
Question
Question
Question
Question
Question
Question
Question
Question
Question
Question
There are two key predictions about how extinction probability and colonization probability affect metapopulation dynamics. List these predictions and explain how they are illustrated by this figure.
Question
Question
Question
Question
Question
Question
Question

Unlock Deck
Sign up to unlock the cards in this deck!
Unlock Deck
Unlock Deck
1/60
Play
Full screen (f)
Deck 13: Population Dynamics Over Space and Time
1
Use the following figure to answers questions 16 to 18:
Which panel is most likely to indicate a population with a constant environment and no time delays in density dependence?
A) a
B) b
C) c
D) d
Which panel is most likely to indicate a population with a constant environment and no time delays in density dependence?
A) a
B) b
C) c
D) d
A
2
Use the following figure to answers questions 16 to 18:
Which panel illustrates a population growing under a logistic model with time delays of 2 years, intrinsic rate of population increase of 0.5, and carrying capacity of 250 individuals?
A) a
B) b
C) c
D) d
Which panel illustrates a population growing under a logistic model with time delays of 2 years, intrinsic rate of population increase of 0.5, and carrying capacity of 250 individuals?
A) a
B) b
C) c
D) d
B
3
Consider a logistic model that includes a time delay in density dependence and exhibits dampened oscillations. If the intrinsic rate of increase is reduced but all other parameters remain the same, which of the following outcomes is most likely?
A) The overall population will decrease.
B) The overall population will increase.
C) The population will approach carrying capacity without any oscillations.
D) The population will oscillate as a stable limit cycle.
A) The overall population will decrease.
B) The overall population will increase.
C) The population will approach carrying capacity without any oscillations.
D) The population will oscillate as a stable limit cycle.
C
4
What typically occurs when the number of individuals in a population exceeds the population's carrying capacity?
A) The number of individuals continues to increase but at a faster rate.
B) The number of individuals continues to increase but at a slower rate.
C) The number of individuals reaches equilibrium and becomes constant.
D) The number of individuals declines.
A) The number of individuals continues to increase but at a faster rate.
B) The number of individuals continues to increase but at a slower rate.
C) The number of individuals reaches equilibrium and becomes constant.
D) The number of individuals declines.
Unlock Deck
Unlock for access to all 60 flashcards in this deck.
Unlock Deck
k this deck
5
Which conclusion does the figure support?A) Recruitment of all species has been constant.
B) Oak may have had increased recruitment since 1650.
C) White pine may have had decreased recruitment since 1650.
D) Eastern hemlock has had decreased recruitment since 1650.
Unlock Deck
Unlock for access to all 60 flashcards in this deck.
Unlock Deck
k this deck
6
Consider moose that breed in the fall and give birth in the spring. During breeding, the moose population is below carrying capacity, but once the young moose are born, the moose population far exceeds carrying capacity. This is an example of
A) delayed density dependence.
B) demographic stochasticity.
C) dampened oscillations.
D) rescue effect.
A) delayed density dependence.
B) demographic stochasticity.
C) dampened oscillations.
D) rescue effect.
Unlock Deck
Unlock for access to all 60 flashcards in this deck.
Unlock Deck
k this deck
7
Many species exhibit population cycles with peaks at regular intervals, such as peaks in population size that occur every 6 years. Explain why it is not likely that environmental variation is the underlying cause of these regular cycles. As part of your explanation, include a description of expected differences between changes in population size due to environmental variation and changes in population size due to density-dependent population regulation.
Unlock Deck
Unlock for access to all 60 flashcards in this deck.
Unlock Deck
k this deck
8
Which is TRUE about dampened oscillations?
I) They are a pattern of population growth in which a population continues to exhibit large oscillations over time.
II) They are a form of demographic stochasticity.
III) They are expected to occur when rτ = 1.
A) I only
B) II only
C) III only
D) I and II only
E) II and III only
I) They are a pattern of population growth in which a population continues to exhibit large oscillations over time.
II) They are a form of demographic stochasticity.
III) They are expected to occur when rτ = 1.
A) I only
B) II only
C) III only
D) I and II only
E) II and III only
Unlock Deck
Unlock for access to all 60 flashcards in this deck.
Unlock Deck
k this deck
9
A population die-off occurs when
I) a species' resources are depleted.
II) an overshoot occurs.
III) carrying capacity is exceeded.
A) I only
B) II only
C) III only
D) II and III only
E) I, II, and III
I) a species' resources are depleted.
II) an overshoot occurs.
III) carrying capacity is exceeded.
A) I only
B) II only
C) III only
D) II and III only
E) I, II, and III
Unlock Deck
Unlock for access to all 60 flashcards in this deck.
Unlock Deck
k this deck
10
Delayed density dependence
A) occurs when a population is larger than the carrying capacity.
B) occurs when density dependence is based on population density in the past.
C) is the observation that populations increase and decrease over time.
D) is a form of environmental stochasticity.
A) occurs when a population is larger than the carrying capacity.
B) occurs when density dependence is based on population density in the past.
C) is the observation that populations increase and decrease over time.
D) is a form of environmental stochasticity.
Unlock Deck
Unlock for access to all 60 flashcards in this deck.
Unlock Deck
k this deck
11
In the logistic growth model that includes delayed density dependence, the term τ indicates
A) the strength of density dependence.
B) the previous carrying capacity.
C) the length of the time delay.
D) the current population size.
A) the strength of density dependence.
B) the previous carrying capacity.
C) the length of the time delay.
D) the current population size.
Unlock Deck
Unlock for access to all 60 flashcards in this deck.
Unlock Deck
k this deck
12
Based on the figure, which year produced an unusually high number of offspring?A) 1942
B) 1943
C) 1944
D) 1945
E) 1946
Unlock Deck
Unlock for access to all 60 flashcards in this deck.
Unlock Deck
k this deck
13
Which of the following is an example of delayed density dependence?
I) The per capita growth rate of a coyote population decreases as the number of coyotes increases.
II) The fecundity of two-year-old frogs is based on their density as tadpoles.
III) The number of seeds produced by flowers in the fall depends on the amount of rainfall the previous spring.
A) I only
B) II only
C) III only
D) I and II only
E) II and III only
Unlock Deck
Unlock for access to all 60 flashcards in this deck.
Unlock Deck
k this deck
14
A herd of 25 caribou was introduced to St. Paul Island in 1911. The line shows the number of caribou on the island. Which describe(s) the entire figure correctly?I) The pattern fits the exponential model of population growth.
II) The population experienced an overshoot.
III) The population experienced a die-off.
A) I only
B) II only
C) III only
D) II and III only
E) I, II, and III
Unlock Deck
Unlock for access to all 60 flashcards in this deck.
Unlock Deck
k this deck
15
Which trait(s) is (are) likely to cause less-stable population fluctuations over time?
I) short generation time
II) small body size
III) high sensitivity to environmental conditions
A) I only
B) II only
C) III only
D) I and II only
E) I, II, and III
I) short generation time
II) small body size
III) high sensitivity to environmental conditions
A) I only
B) II only
C) III only
D) I and II only
E) I, II, and III
Unlock Deck
Unlock for access to all 60 flashcards in this deck.
Unlock Deck
k this deck
16
Population cycles
I) are increases and decreases of population size occurring at regular time intervals.
II) can be caused by overshooting carrying capacity and subsequent die-offs.
III) indicate that a species is about to become extinct.
A) I only
B) II only
C) III only
D) I and II only
E) II, and III only
I) are increases and decreases of population size occurring at regular time intervals.
II) can be caused by overshooting carrying capacity and subsequent die-offs.
III) indicate that a species is about to become extinct.
A) I only
B) II only
C) III only
D) I and II only
E) II, and III only
Unlock Deck
Unlock for access to all 60 flashcards in this deck.
Unlock Deck
k this deck
17
Use the following figure to answers questions 16 to 18:
Which panel illustrates a stable limit cycle?
A) a
B) b
C) c
D) d
Which panel illustrates a stable limit cycle?
A) a
B) b
C) c
D) d
Unlock Deck
Unlock for access to all 60 flashcards in this deck.
Unlock Deck
k this deck
18
In the logistic growth model with time delays, the product of rτ indicates
A) the carrying capacity of a population.
B) the extent of oscillations in population size.
C) the amount of demographic stochasticity.
D) the amount of environmental stochasticity.
A) the carrying capacity of a population.
B) the extent of oscillations in population size.
C) the amount of demographic stochasticity.
D) the amount of environmental stochasticity.
Unlock Deck
Unlock for access to all 60 flashcards in this deck.
Unlock Deck
k this deck
19
In the logistic model with delayed density dependence, an increase in the length of the time delay will affect population dynamics by
A) making it more likely that the population approaches K without oscillations.
B) making it more likely that the population will oscillate.
C) decreasing the mean population size.
D) increasing the mean population size.
A) making it more likely that the population approaches K without oscillations.
B) making it more likely that the population will oscillate.
C) decreasing the mean population size.
D) increasing the mean population size.
Unlock Deck
Unlock for access to all 60 flashcards in this deck.
Unlock Deck
k this deck
20
In population dynamics following the logistic model, an overshoot occurs when
A) N = K/2.
B) N = r/2.
C) N > K.
D) N > r.
A) N = K/2.
B) N = r/2.
C) N > K.
D) N > r.
Unlock Deck
Unlock for access to all 60 flashcards in this deck.
Unlock Deck
k this deck
21
Which is an example of demographic stochasticity?
I) increased moose mortality when the population exceeds carrying capacity
II) variation in death rate of mice due to chance differences between individuals
III) increases and decreases in seed production due to changes in rainfall
A) I only
B) II only
C) III only
D) I and II only
E) II and III only
Unlock Deck
Unlock for access to all 60 flashcards in this deck.
Unlock Deck
k this deck
22
Consider these two populations, which exhibit variation in population size over time. In which population is the fluctuation most likely due to environmental variation, and in which population is fluctuation most likely due to density dependence? Explain your answer.
Unlock Deck
Unlock for access to all 60 flashcards in this deck.
Unlock Deck
k this deck
23
A biologist is developing models to describe the population dynamics of the species he studies. Four models are listed. Each model is based on the logistic model, with r equal to 1 and K equal to 100. The initial population size is given by N0. In which of his models of population growth would the population be most likely to go extinct?
A) deterministic model, N0 = 5
B) stochastic model, N0 = 10
C) deterministic model, N0 = 100
D) stochastic model, N0 = 150
A) deterministic model, N0 = 5
B) stochastic model, N0 = 10
C) deterministic model, N0 = 100
D) stochastic model, N0 = 150
Unlock Deck
Unlock for access to all 60 flashcards in this deck.
Unlock Deck
k this deck
24
Which type of model always includes random variation?
A) stochastic
B) deterministic
C) logistic
D) exponential
A) stochastic
B) deterministic
C) logistic
D) exponential
Unlock Deck
Unlock for access to all 60 flashcards in this deck.
Unlock Deck
k this deck
25
Consider four populations of island birds. Each island has a different carrying capacity, and the birds are subject to environmental and demographic stochasticity. Which population is LEAST likely to go extinct?
A) island 1, K = 100
B) island 2, K = 300
C) island 3, K = 900
D) island 4, K = 1,200
A) island 1, K = 100
B) island 2, K = 300
C) island 3, K = 900
D) island 4, K = 1,200
Unlock Deck
Unlock for access to all 60 flashcards in this deck.
Unlock Deck
k this deck
26
Which statement correctly identifies the relationship between population size and extinction risk?
A) Small populations are most likely to go extinct.
B) Intermediate-sized populations are most likely to go extinct.
C) Large populations are most likely to go extinct.
D) Population size does not correlate with extinction risk.
A) Small populations are most likely to go extinct.
B) Intermediate-sized populations are most likely to go extinct.
C) Large populations are most likely to go extinct.
D) Population size does not correlate with extinction risk.
Unlock Deck
Unlock for access to all 60 flashcards in this deck.
Unlock Deck
k this deck
27
. Which of the following is MOST likely to explain why Daphnia exhibits greater oscillations in population size than Bosmina?
A) Daphnia exhibits delayed density dependence; Bosmina does not.
B) Bosmina exhibits delayed density dependence; Daphnia does not.
C) Daphnia's carrying capacity is higher than Bosmina's.
D) Daphnia's carrying capacity is lower than Bosmina's.
Which of the following is MOST likely to explain why Daphnia exhibits greater oscillations in population size than Bosmina?A) Daphnia exhibits delayed density dependence; Bosmina does not.
B) Bosmina exhibits delayed density dependence; Daphnia does not.
C) Daphnia's carrying capacity is higher than Bosmina's.
D) Daphnia's carrying capacity is lower than Bosmina's.
Unlock Deck
Unlock for access to all 60 flashcards in this deck.
Unlock Deck
k this deck
28
Of the following species, which is most likely to exhibit a stable limit cycle or dampened oscillations?
A) A species with limited energy reserves such that resource availability in previous years does not affect its current ability to survive or produce offspring
B) A species whose fecundity in the present year is highly dependent on the amount of rainfall 2 years previous
C) A species whose only food resources for juveniles are limited and juvenile food availability affects adult fecundity and survival
D) A species whose population growth is following the exponential model
Unlock Deck
Unlock for access to all 60 flashcards in this deck.
Unlock Deck
k this deck
29
Consider a logistic model that includes a time delay in density dependence and exhibits dampened oscillations. If the carrying capacity is increased but all other parameters remain the same, which of the following outcomes is most likely?
A) The population will approach carrying capacity without any oscillations.
B) The population will continue to exhibit dampened oscillations.
C) The population will oscillate as a stable limit cycle.
D) The population will go extinct.
A) The population will approach carrying capacity without any oscillations.
B) The population will continue to exhibit dampened oscillations.
C) The population will oscillate as a stable limit cycle.
D) The population will go extinct.
Unlock Deck
Unlock for access to all 60 flashcards in this deck.
Unlock Deck
k this deck
30
Variation in birth and death rates due to random differences among individuals is
A) overshooting the carrying capacity.
B) demographic stochasticity.
C) environmental stochasticity.
D) habitat fragmentation.
A) overshooting the carrying capacity.
B) demographic stochasticity.
C) environmental stochasticity.
D) habitat fragmentation.
Unlock Deck
Unlock for access to all 60 flashcards in this deck.
Unlock Deck
k this deck
31
For populations growing under the logistic growth model with delayed density dependence, which of the following combinations of parameter values is most likely to lead to dampened oscillations?
A) r = 0.1; K = 200; τ = 2
B) r = 0.1; K = 20 ; τ = 2
C) r = 0.5 ; K = 200; τ = 3
D) r = 1; K =20 ; τ = 3
A) r = 0.1; K = 200; τ = 2
B) r = 0.1; K = 20 ; τ = 2
C) r = 0.5 ; K = 200; τ = 3
D) r = 1; K =20 ; τ = 3
Unlock Deck
Unlock for access to all 60 flashcards in this deck.
Unlock Deck
k this deck
32
Explain the biological reason that higher intrinsic growth rates and longer delays lead to greater oscillations in population size.
Unlock Deck
Unlock for access to all 60 flashcards in this deck.
Unlock Deck
k this deck
33
Two species of mice are similar in many characteristics. However, species A has large fat reserves that increase survival over periods when environmental resources are depleted, while species B has no fat reserves. Which species is more likely to exhibit oscillating population dynamics? Explain your answer.
Unlock Deck
Unlock for access to all 60 flashcards in this deck.
Unlock Deck
k this deck
34
Which population model incorporates random variation in population growth?
A) deterministic
B) stochastic
C) stable limit
D) metapopulation
A) deterministic
B) stochastic
C) stable limit
D) metapopulation
Unlock Deck
Unlock for access to all 60 flashcards in this deck.
Unlock Deck
k this deck
35
Variations in birth and death rates due to random changes in environmental conditions are
A) damped oscillations.
B) delayed density dependence.
C) environmental stochasticity.
D) stable limit cycles.
A) damped oscillations.
B) delayed density dependence.
C) environmental stochasticity.
D) stable limit cycles.
Unlock Deck
Unlock for access to all 60 flashcards in this deck.
Unlock Deck
k this deck
36
Which is an example of environmental stochasticity?
I) changes in the weather that increase or decrease survival by a small amount
II) variation in individual health that affects likelihood of death
III) forest fires that kill large number of individuals every 10 to 50 years
A) I only
B) II only
C) III only
D) I and III only
E) I, II and III
I) changes in the weather that increase or decrease survival by a small amount
II) variation in individual health that affects likelihood of death
III) forest fires that kill large number of individuals every 10 to 50 years
A) I only
B) II only
C) III only
D) I and III only
E) I, II and III
Unlock Deck
Unlock for access to all 60 flashcards in this deck.
Unlock Deck
k this deck
37
Consider a population with the following numbers of individuals over time:
Year 1: 10
Year 2: 25
Year 3: 30
If the population size in year 4 is determined by a logistic model with delayed density dependence from a 1-year time lag and K = 50 individuals, what value of r would lead to the population size to exceed carrying capacity in year 4?
A) r = 0.2
B) r = 0.5
C) r = 1.0
D) r = 2.0
Unlock Deck
Unlock for access to all 60 flashcards in this deck.
Unlock Deck
k this deck
38
Consider the time series of population sizes in years 1 and 2 for populations a, b, c, and
A) year 1, 5 individuals; year 2, 10 individuals
B) year 1, 10 individuals; year 2, 5 individuals
C) year 1, 5 individuals; year 2, 5 individuals
D) If the population size in year 3 is determined by a logistic model with delayed density dependence from a 1-year time lag , r = 1, and K = 10 individuals, which of the following time series of population sizes would lead to an overshoot of the carrying capacity in year 3?
D) year 1, 10 individuals; year 2, 10 individuals
Unlock Deck
Unlock for access to all 60 flashcards in this deck.
Unlock Deck
k this deck
39
The females of a certain species of fish produce on average 1000 eggs each year. By chance some females produce a few more eggs than average, and others produce a slightly fewer eggs than average. This is an example of
A) demographic stochasticity.
B) environmental stochasticity.
C) damped oscillations.
D) population cycles.
A) demographic stochasticity.
B) environmental stochasticity.
C) damped oscillations.
D) population cycles.
Unlock Deck
Unlock for access to all 60 flashcards in this deck.
Unlock Deck
k this deck
40
Consider a population with the following numbers of individuals over time:
Year 1: 100
Year 2: 150
Year 3: 200
Year 4: 250
If the population size in year 5 is determined by a logistic model with delayed density dependence, r = 1.1, and K = 200 individuals, what value of τ would cause the population to decrease from year 4 to year 5?
A) τ = 0
B) τ = 1
C) τ = 2
D) τ = 3
Year 1: 100
Year 2: 150
Year 3: 200
Year 4: 250
If the population size in year 5 is determined by a logistic model with delayed density dependence, r = 1.1, and K = 200 individuals, what value of τ would cause the population to decrease from year 4 to year 5?
A) τ = 0
B) τ = 1
C) τ = 2
D) τ = 3
Unlock Deck
Unlock for access to all 60 flashcards in this deck.
Unlock Deck
k this deck
41
This figure shows a metapopulation for the California spotted owl. Describe two ways in which this real metapopulation differs from the assumptions of the basic model of metapopulation dynamics, = (1 − e/c).
Unlock Deck
Unlock for access to all 60 flashcards in this deck.
Unlock Deck
k this deck
42
Riverview has 200 individuals, Oak Park has 600 individuals, and Mountainside has 50 individuals. Rank the populations in order from the most likely to go extinct to the least likely. Explain your reasoning.
Unlock Deck
Unlock for access to all 60 flashcards in this deck.
Unlock Deck
k this deck
43
When immigrants supplement a declining subpopulation, they prevent the subpopulation from going extinct. This phenomenon is known as
A) a metapopulation.
B) the rescue effect.
C) demographic stochasticity.
D) habitat fragmentation.
A) a metapopulation.
B) the rescue effect.
C) demographic stochasticity.
D) habitat fragmentation.
Unlock Deck
Unlock for access to all 60 flashcards in this deck.
Unlock Deck
k this deck
44
Which is an example of a metapopulation?
I) Insects live in isolated patches of forest surrounded by agriculture. Sometimes the population in a patch goes extinct, but eventually the insects recolonize that patch.
II) A species of bird is found in Canada during the summer. In the fall, the species migrates to the Caribbean and spends the winter there. In the spring it returns to Canada.
III) A species of fish lives in a fast-flowing cold river. A dam is constructed on the river, causing the fish to go extinct because of warmer water.
A) I only
B) II only
C) III only
D) I and II
E) II and III
Unlock Deck
Unlock for access to all 60 flashcards in this deck.
Unlock Deck
k this deck
45
Human activity can affect metapopulations. In the basic model of metapopulation dynamics, if humans improve the quality (and thus carrying capacity) of subpopulations, the probability of _____ and the proportion of occupied patches _____.
A) extinction increases; decreases
B) extinction decreases; increases
C) colonization increases; increases
D) colonization decreases; decreases
A) extinction increases; decreases
B) extinction decreases; increases
C) colonization increases; increases
D) colonization decreases; decreases
Unlock Deck
Unlock for access to all 60 flashcards in this deck.
Unlock Deck
k this deck
46
Based on the predictions of metapopulation biology, which scenario can be expected to exhibit the largest fraction of occupied habitat patches?
A) small patches isolated from one another
B) large patches isolated from one another
C) large patches close to one another
D) small patches close to one another
A) small patches isolated from one another
B) large patches isolated from one another
C) large patches close to one another
D) small patches close to one another
Unlock Deck
Unlock for access to all 60 flashcards in this deck.
Unlock Deck
k this deck
47
Human activity can affect metapopulations. Under the basic model of metapopulation dynamics, when humans make it easier for individuals to travel between patches, the probability of _____ and the proportion of occupied patches _____.
A) extinction increases; decreases
B) extinction decreases; increases
C) colonization increases; increases
D) colonization decreases; decreases
A) extinction increases; decreases
B) extinction decreases; increases
C) colonization increases; increases
D) colonization decreases; decreases
Unlock Deck
Unlock for access to all 60 flashcards in this deck.
Unlock Deck
k this deck
48
A species of frog is found separated into many subpopulations living in ponds that are surrounded by agricultural fields. Sometimes one frog subpopulation goes extinct because of disease or environmental stochasticity. Frogs from other subpopulations will occasionally move across fields to recolonize ponds where subpopulations have gone extinct. This is an example of
A) a metapopulation.
B) the rescue effect.
C) a sink population.
D) damped oscillations.
A) a metapopulation.
B) the rescue effect.
C) a sink population.
D) damped oscillations.
Unlock Deck
Unlock for access to all 60 flashcards in this deck.
Unlock Deck
k this deck
49
Which contributed to the decline and extinction of black-footed ferrets?
I) Habitat destruction reduced carrying capacity of ferrets.
II) Lethal diseases like canine distemper killed many ferrets.
III) Increasingly fragmented ferret populations were more likely to go extinct.
A) I only
B) II only
C) III only
D) I and II only
E) I, II, and III
I) Habitat destruction reduced carrying capacity of ferrets.
II) Lethal diseases like canine distemper killed many ferrets.
III) Increasingly fragmented ferret populations were more likely to go extinct.
A) I only
B) II only
C) III only
D) I and II only
E) I, II, and III
Unlock Deck
Unlock for access to all 60 flashcards in this deck.
Unlock Deck
k this deck
50
Define the three components of the basic model of metapopulation dynamics, = (1 − e/c). Explain one way conservation biologists can affect each of the variables e and c to protect a species.
Unlock Deck
Unlock for access to all 60 flashcards in this deck.
Unlock Deck
k this deck
51
Under the basic model of metapopulation dynamics, when the extinction rate is equal to the colonization rate, we predict that the proportion of patches occupied ( ) will equal
A) 0.
B) 0.25.
C) 0.50.
D) 0.75.
E) 1.
A) 0.
B) 0.25.
C) 0.50.
D) 0.75.
E) 1.
Unlock Deck
Unlock for access to all 60 flashcards in this deck.
Unlock Deck
k this deck
52
Grasslands used to be spread across large portions of North America. However, human land use has separated formerly large, continuous grassland into many smaller isolated patches. This is an example of
A) habitat fragmentation.
B) rescue effect.
C) extinction.
D) dampened oscillations.
A) habitat fragmentation.
B) rescue effect.
C) extinction.
D) dampened oscillations.
Unlock Deck
Unlock for access to all 60 flashcards in this deck.
Unlock Deck
k this deck
53
There are two key predictions about how extinction probability and colonization probability affect metapopulation dynamics. List these predictions and explain how they are illustrated by this figure.
Unlock Deck
Unlock for access to all 60 flashcards in this deck.
Unlock Deck
k this deck
54
A group of subpopulations has independent population dynamics over space. This is an example of
A) habitat fragmentation.
B) a metapopulation.
C) the rescue effect.
D) environmental stochasticity.
A) habitat fragmentation.
B) a metapopulation.
C) the rescue effect.
D) environmental stochasticity.
Unlock Deck
Unlock for access to all 60 flashcards in this deck.
Unlock Deck
k this deck
55
Which is an example of the rescue effect?
I) A small population of birds maintains a stable population size near carrying capacity.
II) A population of mice in a low-quality habitat persists because of immigration from high-quality habitats.
III) Habitat destruction reduces the quality of an environment and causes a population of lizards to decline every year until they go extinct.
A) I only
B) II only
C) III only
D) I and II
E) II and III
Unlock Deck
Unlock for access to all 60 flashcards in this deck.
Unlock Deck
k this deck
56
A species of grass is affected by the amount of rainfall in the spring. In years of high rain, the grass survives better than in years of low rain. This is an example of
A) demographic stochasticity.
B) environmental stochasticity.
C) damped oscillations.
D) population cycles.
A) demographic stochasticity.
B) environmental stochasticity.
C) damped oscillations.
D) population cycles.
Unlock Deck
Unlock for access to all 60 flashcards in this deck.
Unlock Deck
k this deck
57
Which correctly describes metapopulations?
I) They can arise from habitat fragmentation.
II) The frequency of occupied habitats is due to the balance of extinction and colonization.
III) The basic metapopulation model assumes that all patches are equal in quality.
A) I only
B) II only
C) III only
D) II and III only
E) I, II, and III
I) They can arise from habitat fragmentation.
II) The frequency of occupied habitats is due to the balance of extinction and colonization.
III) The basic metapopulation model assumes that all patches are equal in quality.
A) I only
B) II only
C) III only
D) II and III only
E) I, II, and III
Unlock Deck
Unlock for access to all 60 flashcards in this deck.
Unlock Deck
k this deck
58
Metapopulations
A) occur when suitable habitat for a species is separated by unsuitable habitat.
B) are populations whose intrinsic rate of increase (r) is greater than 1.
C) are composed of subpopulations that do not go extinct.
D) are small populations likely to go extinct as a result of demographic stochasticity.
Unlock Deck
Unlock for access to all 60 flashcards in this deck.
Unlock Deck
k this deck
59
Under the basic model of metapopulation dynamics, which of the following conditions is necessary to prevent the species from going extinct?
A) colonization rate greater than zero
B) colonization rate equal to extinction rate
C) colonization rate less than extinction rate
D) colonization rate greater than extinction rate
E) extinction rate less than 1
A) colonization rate greater than zero
B) colonization rate equal to extinction rate
C) colonization rate less than extinction rate
D) colonization rate greater than extinction rate
E) extinction rate less than 1
Unlock Deck
Unlock for access to all 60 flashcards in this deck.
Unlock Deck
k this deck
60
Which of the following contributed to the success of conservation programs that reintroduced ferrets to the wild?
A) Ferrets were introduced into multiple subpopulations.
B) Diseases that kill ferrets were eliminated.
C) Habitat destruction was prevented.
D) Stochastic causes of extinction were removed.
A) Ferrets were introduced into multiple subpopulations.
B) Diseases that kill ferrets were eliminated.
C) Habitat destruction was prevented.
D) Stochastic causes of extinction were removed.
Unlock Deck
Unlock for access to all 60 flashcards in this deck.
Unlock Deck
k this deck
Unlock Deck
Unlock for access to all 60 flashcards in this deck.


