Deck 8: Linear Regression
Full screen (f)
Question
In regression,we sometimes talk about using X to predict Y.In such situations,Y is then called
A)
B)the predictor variable.
C)the criterion variable.
D)the intercept.
A)
B)the predictor variable.
C)the criterion variable.
D)the intercept.
Question
A regression line is used to obtain
A)the Y at each X.
B)the X at each Y.
C)the at any X.
D)the X at any .
.
A)the Y at each X.
B)the X at each Y.
C)the
at any X.D)the X at any
. Question
What is the slope of the following regression equation? 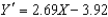
A)3.92
B)-3.92
C)2.69
D)2.69X
A)3.92
B)-3.92
C)2.69
D)2.69X
Question
Question
Question
Question
Question
Which of the following formulas represents the Y intercept of the regression line?
A)
B)
C)
D)
A)
B)
C)
D)
Question
Which of the following is not true of the linear regression equation?
A)It is the equation from which the correlation coefficient is calculated.
B)It defines the straight line that summarizes a relationship.
C)It describes two characteristics of the regression line: its slope and its Y-intercept.
D)It is the equation that produces the value of at each X.
A)It is the equation from which the correlation coefficient is calculated.
B)It defines the straight line that summarizes a relationship.
C)It describes two characteristics of the regression line: its slope and its Y-intercept.
D)It is the equation that produces the value of
at each X. Question
What is the Y-intercept of the following regression equation? 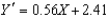
A)0.56X
B)0.56
C)2.41
D)X + 2.41
A)0.56X
B)0.56
C)2.41
D)X + 2.41
Question
In the regression equation,the slope summarizes ______ and the Y-intercept indicates ______.
A)predictor variables;what the value of the criterion variable is
B)the steepness and direction of the regression line;the value of when X = 0
C)the length of the regression line;the starting point of the regression line
D)the starting point from which the Y scores begin to change as the X scores increase;the direction and rate in which Ys change as X increases
A)predictor variables;what the value of the criterion variable is
B)the steepness and direction of the regression line;the value of
when X = 0C)the length of the regression line;the starting point of the regression line
D)the starting point from which the Y scores begin to change as the X scores increase;the direction and rate in which Ys change as X increases
Question
What is the Y-intercept of the following regression equation?  = -4.30X - 1.72
A)-1.72
B)1.72
C)-4.30
D)-4.30X
= -4.30X - 1.72A)-1.72
B)1.72
C)-4.30
D)-4.30X
Question
Question
Question
What is the slope of the following regression equation?  = -8.27X + 3.09
A)8.27
B)-8.27
C)3.09
D)-3.09
= -8.27X + 3.09A)8.27
B)-8.27
C)3.09
D)-3.09
Question
The Y-intercept is the value of  when X equals
A)1.0
B)0.0
C)-1.0
D)2.0
when X equalsA)1.0
B)0.0
C)-1.0
D)2.0
Question
Which of the following is NOT representative of a strong relationship?
A)Y scores that are relatively close to their corresponding scores.
B)A correlation coefficient close to 1.
C)Y scores that are spread out.
D)Less prediction error and a smaller value of
A)Y scores that are relatively close to their corresponding
scores.B)A correlation coefficient close to 1.
C)Y scores that are spread out.
D)Less prediction error and a smaller value of
Question
Which of the following formulas represents the slope of the regression line?
A)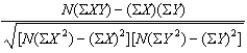
B)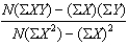
C)
D)
A)
B)
C)
D)
Question
 is
isA)the actual Y scores.
B)the predicted Y scores.
C)the standard deviation of Y.
D)the standard error of the estimate.
Question
Question
For the following data,what is the predicted test score for a person with a stress level of 10? 
A)0.76
B)20.93
C)-7.16
D)12.43
A)0.76
B)20.93
C)-7.16
D)12.43
Question
One assumption of linear regression is
A)the Y scores at each X form an approximately normal distribution.
B)the X scores at each Y form an approximately normal distribution.
C)at each X,both the X and Y score samples should represent an approximately normal distribution.
D)at each X,approximately 68% of all Y scores should be between .
.
A)the Y scores at each X form an approximately normal distribution.
B)the X scores at each Y form an approximately normal distribution.
C)at each X,both the X and Y score samples should represent an approximately normal distribution.
D)at each X,approximately 68% of all Y scores should be between
. Question
For the following data,what is the standard error of the estimate? 
A)3.71
B)5.72
C)32.72
D)1,070.49
A)3.71
B)5.72
C)32.72
D)1,070.49
Question
For the following data,what is the regression equation? 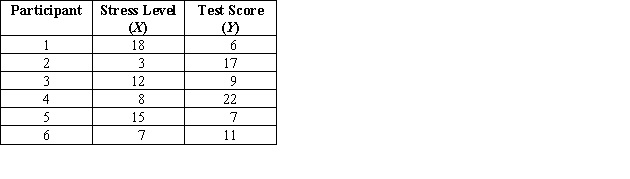
A) = 20.93X - 0.85
B) = -0.85 X + 20.93
C) = 20.93 X + 0.85
D) = 0.85 X + 20.93
A)
= 20.93X - 0.85B)
= -0.85 X + 20.93C)
= 20.93 X + 0.85D)
= 0.85 X + 20.93 Question
The sum of the deviations of the true Y scores from the predicted  scores is always
A)zero.
B)a very large number.
C)equal to N times the mean of Y.
D)negative.
scores is alwaysA)zero.
B)a very large number.
C)equal to N times the mean of Y.
D)negative.
Question
Question
A nutrition major at State University was studying the relationship between carbohydrates (X)and calories (Y).For example,a serving of a particular brand of wheat pasta yielded 42 carbohydrates and 210 calories.After collecting X and Y data on many kinds of foods,the student determined the slope of the regression line to be 4.0 and the Y intercept to be 3.0.If a new food is tested,and the number of carbohydrates (X)is 100,what would be the predicted calories (  )?
)?
A)304
B)403
C)305
D)504
)?A)304
B)403
C)305
D)504
Question
If the correlation coefficient turns out to be a relatively high value,then the value of  will be
A)relatively low.
B)relatively high.
C)unrelated to the value of r.
D)low if r is positive and high if r is negative.
will beA)relatively low.
B)relatively high.
C)unrelated to the value of r.
D)low if r is positive and high if r is negative.
Question
Question
Question
In a study of the relationship between amount of sugar consumed (X)and excitability (Y)in children,the regression equation was calculated to be 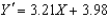 .The amount of sugar consumed ranged from 1 to 4 ounces.Which of the following graphs correctly displays the regression line?
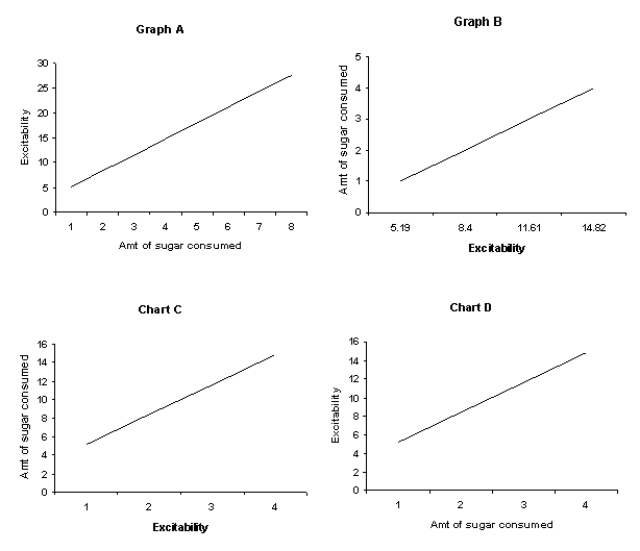
A)Graph A
B)Graph B
C)Graph C
D)Graph D
.The amount of sugar consumed ranged from 1 to 4 ounces.Which of the following graphs correctly displays the regression line? A)Graph A
B)Graph B
C)Graph C
D)Graph D
Question
To predict a  score from a given X score using the regression equation,we would
A)first multiply X by the slope and then add the Y-intercept.
B)first multiply X by the Y-intercept and then add the slope.
C)first add the Y-intercept to X and then multiply by the slope.
D)first add the slope to X and then multiply by the Y-intercept.
score from a given X score using the regression equation,we wouldA)first multiply X by the slope and then add the Y-intercept.
B)first multiply X by the Y-intercept and then add the slope.
C)first add the Y-intercept to X and then multiply by the slope.
D)first add the slope to X and then multiply by the Y-intercept.
Question
Question
In the following study,researchers wanted to determine if a relationship existed between the minutes of light therapy a patient receives and the patient's reported score on a seasonal affective disorder (SAD)test.What is the regression equation for the data below? 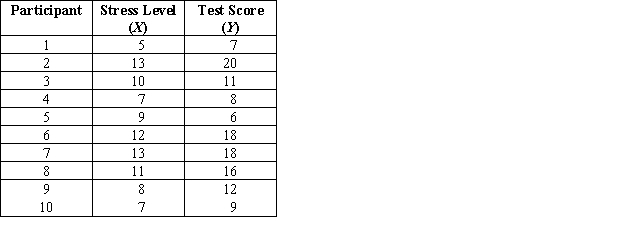
A) = -3.08X + 1.64
B) = 9.5 X + 12.5
C) = 2.69 X - 0.49
D) = 1.64 X - 3.08
A)
= -3.08X + 1.64B)
= 9.5 X + 12.5C)
= 2.69 X - 0.49D)
= 1.64 X - 3.08 Question
Heteroscedasticity occurs when
A)there is a nonlinear relationship between the X and Y scores.
B)the scores are spread out to the same degree at every X.
C)the Y scores are spread out to the same degree at every X.
D)the Y scores have a different degree of spread at different Xs.
A)there is a nonlinear relationship between the X and Y scores.
B)the
scores are spread out to the same degree at every X.C)the Y scores are spread out to the same degree at every X.
D)the Y scores have a different degree of spread at different Xs.
Question
Computing the standard error of the estimate (  )by subtracting each
  from the corresponding Y,squaring the difference,summing the results,dividing by N,and then taking the square root (the defining formula)is difficult and time-consuming.Fortunately,the same value can be computed by multiplying the standard deviation of Y (i.e. ,
  )by
)by
A)100
B)
C)
D)0.5
)by subtracting each from the corresponding Y,squaring the difference,summing the results,dividing by N,and then taking the square root (the defining formula)is difficult and time-consuming.Fortunately,the same value can be computed by multiplying the standard deviation of Y (i.e. , )byA)100
B)
C)
D)0.5
Question
When r = 1.0,then  equals
A)r
B)0
C)1.0
D)
equalsA)r
B)0
C)1.0
D)
Question
In the following study,researchers wanted to determine if a relationship existed between the minutes of light therapy a patient receives and the patient's reported score on a seasonal affective disorder (SAD)test.What is the standard error of the estimate? 
A)2.31
B)4.86
C)5.34
D)1.52
A)2.31
B)4.86
C)5.34
D)1.52
Question
When there is no relationship between two variables,the value of every  is equal to
A)the value of every X.
B)the value of every Y.
C)the value of the Y-intercept.
D)zero.
is equal toA)the value of every X.
B)the value of every Y.
C)the value of the Y-intercept.
D)zero.
Question
When r = 0.0,the value of  is equal to
A)
B)0
C)1.0
D)
is equal toA)
B)0
C)1.0
D)
Question
Question
When we square the correlation coefficient to produce  ,the result is equal to the
A)proportion of variance not accounted for.
B)proportion of variance accounted for.
C)standard error of the estimate.
D)coefficient of alienation.
,the result is equal to theA)proportion of variance not accounted for.
B)proportion of variance accounted for.
C)standard error of the estimate.
D)coefficient of alienation.
Question
Question
Question
For the following data,what is the proportion of variance accounted for? 
A)-0.76
B)0.58
C)0.76
D)-0.58
A)-0.76
B)0.58
C)0.76
D)-0.58
Question
When we use a relationship to predict scores,our error is
A)the mean of Y.
B)the mean of X.
C) .
.
D) .
.
A)the mean of Y.
B)the mean of X.
C)
.D)
. Question
Question
Question
Compared to a strong relationship,a weak relationship between two variables results in
A)greater prediction error and a larger value of .
.
B)greater prediction error and a smaller value of .
.
C)less prediction error and a larger value of .
.
D)less prediction error and a smaller value of .
.
A)greater prediction error and a larger value of
.B)greater prediction error and a smaller value of
.C)less prediction error and a larger value of
.D)less prediction error and a smaller value of
. Question
In the following study,researchers wanted to determine if a relationship existed between the minutes of light therapy a patient receives and the patient's reported score on a seasonal affective disorder (SAD)test.What is the proportion of variance not accounted for? 
A)0.77
B)2.31
C)0.23
D)4.86
A)0.77
B)2.31
C)0.23
D)4.86
Question
The coefficient of determination is equal to
A) .
.
B) .
.
C) .
.
D)
A)
.B)
.C)
.D)
Question
When we divide the error remaining after we use the relationship to predict Y scores (  )by the total error when we use the mean to predict the Y scores (
  )and then subtract the result from 1,the final result is the
A)proportion of variance not accounted for.
B)proportion of variance accounted for.
C)standard error of the estimate.
D)coefficient of alienation.
)by the total error when we use the mean to predict the Y scores ( )and then subtract the result from 1,the final result is theA)proportion of variance not accounted for.
B)proportion of variance accounted for.
C)standard error of the estimate.
D)coefficient of alienation.

Unlock Deck
Sign up to unlock the cards in this deck!
Unlock Deck
Unlock Deck
1/52
Play
Full screen (f)
Deck 8: Linear Regression
1
In regression,we sometimes talk about using X to predict Y.In such situations,Y is then called
A)
B)the predictor variable.
C)the criterion variable.
D)the intercept.
A)
B)the predictor variable.
C)the criterion variable.
D)the intercept.
the criterion variable.
2
A regression line is used to obtain
A)the Y at each X.
B)the X at each Y.
C)the at any X.
D)the X at any .
A)the Y at each X.
B)the X at each Y.
C)the
at any X.D)the X at any
.the at any X.
at any X. 3
What is the slope of the following regression equation?
A)3.92
B)-3.92
C)2.69
D)2.69X
A)3.92
B)-3.92
C)2.69
D)2.69X
2.69
4
The linear regression line indicates
A)whether a relationship exists.
B)the strength of a relationship.
C)the direction of a relationship.
D)the best-fitting straight line in a linear relationship.
A)whether a relationship exists.
B)the strength of a relationship.
C)the direction of a relationship.
D)the best-fitting straight line in a linear relationship.
Unlock Deck
Unlock for access to all 52 flashcards in this deck.
Unlock Deck
k this deck
5
The slope of a line is a number indicating the
A)slant of the line and the Y-intercept.
B)slant of the line and the direction in which it slants.
C)slant of the line and the X-intercept.
D)length of the regression line to be drawn.
A)slant of the line and the Y-intercept.
B)slant of the line and the direction in which it slants.
C)slant of the line and the X-intercept.
D)length of the regression line to be drawn.
Unlock Deck
Unlock for access to all 52 flashcards in this deck.
Unlock Deck
k this deck
6
Linear regression is important because
A)it is used to predict unknown Y scores based on X scores from a correlated variable.
B)it is used to predict unknown Y scores based on X scores,even if the X variable is not correlated with the Y variable.
C)it is a statistic that summarizes the relationship between the X and Y variables.
D)it indicates how close our predictions of Y values are to the actual Y values.
Unlock Deck
Unlock for access to all 52 flashcards in this deck.
Unlock Deck
k this deck
7
The best-fitting line through a scatterplot is known as the ______ line.
A)scatterplot
B)correlation
C)variance
D)regression
A)scatterplot
B)correlation
C)variance
D)regression
Unlock Deck
Unlock for access to all 52 flashcards in this deck.
Unlock Deck
k this deck
8
Which of the following formulas represents the Y intercept of the regression line?
A)
B)
C)
D)
A)
B)
C)
D)
Unlock Deck
Unlock for access to all 52 flashcards in this deck.
Unlock Deck
k this deck
9
Which of the following is not true of the linear regression equation?
A)It is the equation from which the correlation coefficient is calculated.
B)It defines the straight line that summarizes a relationship.
C)It describes two characteristics of the regression line: its slope and its Y-intercept.
D)It is the equation that produces the value of at each X.
A)It is the equation from which the correlation coefficient is calculated.
B)It defines the straight line that summarizes a relationship.
C)It describes two characteristics of the regression line: its slope and its Y-intercept.
D)It is the equation that produces the value of
at each X. Unlock Deck
Unlock for access to all 52 flashcards in this deck.
Unlock Deck
k this deck
10
What is the Y-intercept of the following regression equation?
A)0.56X
B)0.56
C)2.41
D)X + 2.41
A)0.56X
B)0.56
C)2.41
D)X + 2.41
Unlock Deck
Unlock for access to all 52 flashcards in this deck.
Unlock Deck
k this deck
11
In the regression equation,the slope summarizes ______ and the Y-intercept indicates ______.
A)predictor variables;what the value of the criterion variable is
B)the steepness and direction of the regression line;the value of when X = 0
C)the length of the regression line;the starting point of the regression line
D)the starting point from which the Y scores begin to change as the X scores increase;the direction and rate in which Ys change as X increases
A)predictor variables;what the value of the criterion variable is
B)the steepness and direction of the regression line;the value of
when X = 0C)the length of the regression line;the starting point of the regression line
D)the starting point from which the Y scores begin to change as the X scores increase;the direction and rate in which Ys change as X increases
Unlock Deck
Unlock for access to all 52 flashcards in this deck.
Unlock Deck
k this deck
12
What is the Y-intercept of the following regression equation? = -4.30X - 1.72
A)-1.72
B)1.72
C)-4.30
D)-4.30X
= -4.30X - 1.72A)-1.72
B)1.72
C)-4.30
D)-4.30X
Unlock Deck
Unlock for access to all 52 flashcards in this deck.
Unlock Deck
k this deck
13
The regression line is the best-fitting line because
A)it best takes into account all the X and Y scores.
B)on average,the regression line passes through the center of the various Y standard deviations.
C)it is the straightest line that can be created through the Y scores.
D)on average,the regression line passes through the center of the various Y means.
Unlock Deck
Unlock for access to all 52 flashcards in this deck.
Unlock Deck
k this deck
14
In looking at the regression equation,we know that the relationship is negative if the
A)Y-intercept value is negative.
B)slope value is negative.
C)slope value is zero.
D)Y-intercept value is zero.
A)Y-intercept value is negative.
B)slope value is negative.
C)slope value is zero.
D)Y-intercept value is zero.
Unlock Deck
Unlock for access to all 52 flashcards in this deck.
Unlock Deck
k this deck
15
What is the slope of the following regression equation? = -8.27X + 3.09
A)8.27
B)-8.27
C)3.09
D)-3.09
= -8.27X + 3.09A)8.27
B)-8.27
C)3.09
D)-3.09
Unlock Deck
Unlock for access to all 52 flashcards in this deck.
Unlock Deck
k this deck
16
The Y-intercept is the value of when X equals
A)1.0
B)0.0
C)-1.0
D)2.0
when X equalsA)1.0
B)0.0
C)-1.0
D)2.0
Unlock Deck
Unlock for access to all 52 flashcards in this deck.
Unlock Deck
k this deck
17
Which of the following is NOT representative of a strong relationship?
A)Y scores that are relatively close to their corresponding scores.
B)A correlation coefficient close to 1.
C)Y scores that are spread out.
D)Less prediction error and a smaller value of
A)Y scores that are relatively close to their corresponding
scores.B)A correlation coefficient close to 1.
C)Y scores that are spread out.
D)Less prediction error and a smaller value of
Unlock Deck
Unlock for access to all 52 flashcards in this deck.
Unlock Deck
k this deck
18
Which of the following formulas represents the slope of the regression line?
A)
B)
C)
D)
A)
B)
C)
D)
Unlock Deck
Unlock for access to all 52 flashcards in this deck.
Unlock Deck
k this deck
19
isA)the actual Y scores.
B)the predicted Y scores.
C)the standard deviation of Y.
D)the standard error of the estimate.
Unlock Deck
Unlock for access to all 52 flashcards in this deck.
Unlock Deck
k this deck
20
If there is no relationship between two variables,the slope of the regression line will equal
A)1.0
B)0.5
C)0.0
D)-1.0
A)1.0
B)0.5
C)0.0
D)-1.0
Unlock Deck
Unlock for access to all 52 flashcards in this deck.
Unlock Deck
k this deck
21
For the following data,what is the predicted test score for a person with a stress level of 10?
A)0.76
B)20.93
C)-7.16
D)12.43
A)0.76
B)20.93
C)-7.16
D)12.43
Unlock Deck
Unlock for access to all 52 flashcards in this deck.
Unlock Deck
k this deck
22
One assumption of linear regression is
A)the Y scores at each X form an approximately normal distribution.
B)the X scores at each Y form an approximately normal distribution.
C)at each X,both the X and Y score samples should represent an approximately normal distribution.
D)at each X,approximately 68% of all Y scores should be between .
A)the Y scores at each X form an approximately normal distribution.
B)the X scores at each Y form an approximately normal distribution.
C)at each X,both the X and Y score samples should represent an approximately normal distribution.
D)at each X,approximately 68% of all Y scores should be between
. Unlock Deck
Unlock for access to all 52 flashcards in this deck.
Unlock Deck
k this deck
23
For the following data,what is the standard error of the estimate?
A)3.71
B)5.72
C)32.72
D)1,070.49
A)3.71
B)5.72
C)32.72
D)1,070.49
Unlock Deck
Unlock for access to all 52 flashcards in this deck.
Unlock Deck
k this deck
24
For the following data,what is the regression equation?
A) = 20.93X - 0.85
B) = -0.85 X + 20.93
C) = 20.93 X + 0.85
D) = 0.85 X + 20.93
A)
= 20.93X - 0.85B)
= -0.85 X + 20.93C)
= 20.93 X + 0.85D)
= 0.85 X + 20.93 Unlock Deck
Unlock for access to all 52 flashcards in this deck.
Unlock Deck
k this deck
25
The sum of the deviations of the true Y scores from the predicted scores is always
A)zero.
B)a very large number.
C)equal to N times the mean of Y.
D)negative.
scores is alwaysA)zero.
B)a very large number.
C)equal to N times the mean of Y.
D)negative.
Unlock Deck
Unlock for access to all 52 flashcards in this deck.
Unlock Deck
k this deck
26
Homoscedasticity occurs when
A)there is a nonlinear relationship between the X and Y scores.
B)the Y scores have a different degree of spread at different Xs.
C)the Y scores are spread out to the same degree at every X.
D)the Y' scores are spread out to the same degree at every X.
A)there is a nonlinear relationship between the X and Y scores.
B)the Y scores have a different degree of spread at different Xs.
C)the Y scores are spread out to the same degree at every X.
D)the Y' scores are spread out to the same degree at every X.
Unlock Deck
Unlock for access to all 52 flashcards in this deck.
Unlock Deck
k this deck
27
A nutrition major at State University was studying the relationship between carbohydrates (X)and calories (Y).For example,a serving of a particular brand of wheat pasta yielded 42 carbohydrates and 210 calories.After collecting X and Y data on many kinds of foods,the student determined the slope of the regression line to be 4.0 and the Y intercept to be 3.0.If a new food is tested,and the number of carbohydrates (X)is 100,what would be the predicted calories ( )?
A)304
B)403
C)305
D)504
)?A)304
B)403
C)305
D)504
Unlock Deck
Unlock for access to all 52 flashcards in this deck.
Unlock Deck
k this deck
28
If the correlation coefficient turns out to be a relatively high value,then the value of will be
A)relatively low.
B)relatively high.
C)unrelated to the value of r.
D)low if r is positive and high if r is negative.
will beA)relatively low.
B)relatively high.
C)unrelated to the value of r.
D)low if r is positive and high if r is negative.
Unlock Deck
Unlock for access to all 52 flashcards in this deck.
Unlock Deck
k this deck
29
The standard error of the estimate is similar to the
A)sum of the actual Y scores around their predicted Y' scores.
B)standard deviation of actual Y scores around their predicted Y' scores.
C)degree to which any predicted Y' will deviate from its actual Y score.
D)standard deviation of actual Y scores around their actual X scores.
A)sum of the actual Y scores around their predicted Y' scores.
B)standard deviation of actual Y scores around their predicted Y' scores.
C)degree to which any predicted Y' will deviate from its actual Y score.
D)standard deviation of actual Y scores around their actual X scores.
Unlock Deck
Unlock for access to all 52 flashcards in this deck.
Unlock Deck
k this deck
30
The "error" in a single prediction is equal to the degree to which a participant's ______ score deviates from the ______.
A)actual;mean
B)predicted;mean
C)predicted;given X
D)actual;corresponding predicted score
A)actual;mean
B)predicted;mean
C)predicted;given X
D)actual;corresponding predicted score
Unlock Deck
Unlock for access to all 52 flashcards in this deck.
Unlock Deck
k this deck
31
In a study of the relationship between amount of sugar consumed (X)and excitability (Y)in children,the regression equation was calculated to be .The amount of sugar consumed ranged from 1 to 4 ounces.Which of the following graphs correctly displays the regression line?
A)Graph A
B)Graph B
C)Graph C
D)Graph D
.The amount of sugar consumed ranged from 1 to 4 ounces.Which of the following graphs correctly displays the regression line? A)Graph A
B)Graph B
C)Graph C
D)Graph D
Unlock Deck
Unlock for access to all 52 flashcards in this deck.
Unlock Deck
k this deck
32
To predict a score from a given X score using the regression equation,we would
A)first multiply X by the slope and then add the Y-intercept.
B)first multiply X by the Y-intercept and then add the slope.
C)first add the Y-intercept to X and then multiply by the slope.
D)first add the slope to X and then multiply by the Y-intercept.
score from a given X score using the regression equation,we wouldA)first multiply X by the slope and then add the Y-intercept.
B)first multiply X by the Y-intercept and then add the slope.
C)first add the Y-intercept to X and then multiply by the slope.
D)first add the slope to X and then multiply by the Y-intercept.
Unlock Deck
Unlock for access to all 52 flashcards in this deck.
Unlock Deck
k this deck
33
When heteroscedasticity exists,the problem with r is that it
A)does not accurately describe the predicted Y values.
B)is very large.
C)does not accurately describe the strength of the relationship for all Xs.
D)will equal 0.
A)does not accurately describe the predicted Y values.
B)is very large.
C)does not accurately describe the strength of the relationship for all Xs.
D)will equal 0.
Unlock Deck
Unlock for access to all 52 flashcards in this deck.
Unlock Deck
k this deck
34
In the following study,researchers wanted to determine if a relationship existed between the minutes of light therapy a patient receives and the patient's reported score on a seasonal affective disorder (SAD)test.What is the regression equation for the data below?
A) = -3.08X + 1.64
B) = 9.5 X + 12.5
C) = 2.69 X - 0.49
D) = 1.64 X - 3.08
A)
= -3.08X + 1.64B)
= 9.5 X + 12.5C)
= 2.69 X - 0.49D)
= 1.64 X - 3.08 Unlock Deck
Unlock for access to all 52 flashcards in this deck.
Unlock Deck
k this deck
35
Heteroscedasticity occurs when
A)there is a nonlinear relationship between the X and Y scores.
B)the scores are spread out to the same degree at every X.
C)the Y scores are spread out to the same degree at every X.
D)the Y scores have a different degree of spread at different Xs.
A)there is a nonlinear relationship between the X and Y scores.
B)the
scores are spread out to the same degree at every X.C)the Y scores are spread out to the same degree at every X.
D)the Y scores have a different degree of spread at different Xs.
Unlock Deck
Unlock for access to all 52 flashcards in this deck.
Unlock Deck
k this deck
36
Computing the standard error of the estimate ( )by subtracting each from the corresponding Y,squaring the difference,summing the results,dividing by N,and then taking the square root (the defining formula)is difficult and time-consuming.Fortunately,the same value can be computed by multiplying the standard deviation of Y (i.e. , )by
A)100
B)
C)
D)0.5
)by subtracting each from the corresponding Y,squaring the difference,summing the results,dividing by N,and then taking the square root (the defining formula)is difficult and time-consuming.Fortunately,the same value can be computed by multiplying the standard deviation of Y (i.e. , )byA)100
B)
C)
D)0.5
Unlock Deck
Unlock for access to all 52 flashcards in this deck.
Unlock Deck
k this deck
37
When r = 1.0,then equals
A)r
B)0
C)1.0
D)
equalsA)r
B)0
C)1.0
D)
Unlock Deck
Unlock for access to all 52 flashcards in this deck.
Unlock Deck
k this deck
38
In the following study,researchers wanted to determine if a relationship existed between the minutes of light therapy a patient receives and the patient's reported score on a seasonal affective disorder (SAD)test.What is the standard error of the estimate?
A)2.31
B)4.86
C)5.34
D)1.52
A)2.31
B)4.86
C)5.34
D)1.52
Unlock Deck
Unlock for access to all 52 flashcards in this deck.
Unlock Deck
k this deck
39
When there is no relationship between two variables,the value of every is equal to
A)the value of every X.
B)the value of every Y.
C)the value of the Y-intercept.
D)zero.
is equal toA)the value of every X.
B)the value of every Y.
C)the value of the Y-intercept.
D)zero.
Unlock Deck
Unlock for access to all 52 flashcards in this deck.
Unlock Deck
k this deck
40
When r = 0.0,the value of is equal to
A)
B)0
C)1.0
D)
is equal toA)
B)0
C)1.0
D)
Unlock Deck
Unlock for access to all 52 flashcards in this deck.
Unlock Deck
k this deck
41
The coefficient of alienation is interpreted as the
A)amount of variance determined in all the Y scores.
B)alienation of variance in all the Y scores.
C)degree to which the scores are efficient.
D)proportion of variance not accounted for.
A)amount of variance determined in all the Y scores.
B)alienation of variance in all the Y scores.
C)degree to which the scores are efficient.
D)proportion of variance not accounted for.
Unlock Deck
Unlock for access to all 52 flashcards in this deck.
Unlock Deck
k this deck
42
When we square the correlation coefficient to produce ,the result is equal to the
A)proportion of variance not accounted for.
B)proportion of variance accounted for.
C)standard error of the estimate.
D)coefficient of alienation.
,the result is equal to theA)proportion of variance not accounted for.
B)proportion of variance accounted for.
C)standard error of the estimate.
D)coefficient of alienation.
Unlock Deck
Unlock for access to all 52 flashcards in this deck.
Unlock Deck
k this deck
43
We calculate the proportion of variance accounted for because it is the statistical basis for evaluating
A)the usefulness of a relationship.
B)the strength of the correlation coefficient.
C)the linearity of the two scores.
D)the average deviation among the Y scores.
A)the usefulness of a relationship.
B)the strength of the correlation coefficient.
C)the linearity of the two scores.
D)the average deviation among the Y scores.
Unlock Deck
Unlock for access to all 52 flashcards in this deck.
Unlock Deck
k this deck
44
The coefficient of determination is interpreted as the
A)amount of variance determined in all the Y scores.
B)determined amount of variance in all the Y scores.
C)degree to which the scores are efficient.
D)proportion of variance accounted for.
A)amount of variance determined in all the Y scores.
B)determined amount of variance in all the Y scores.
C)degree to which the scores are efficient.
D)proportion of variance accounted for.
Unlock Deck
Unlock for access to all 52 flashcards in this deck.
Unlock Deck
k this deck
45
For the following data,what is the proportion of variance accounted for?
A)-0.76
B)0.58
C)0.76
D)-0.58
A)-0.76
B)0.58
C)0.76
D)-0.58
Unlock Deck
Unlock for access to all 52 flashcards in this deck.
Unlock Deck
k this deck
46
When we use a relationship to predict scores,our error is
A)the mean of Y.
B)the mean of X.
C) .
D) .
A)the mean of Y.
B)the mean of X.
C)
.D)
. Unlock Deck
Unlock for access to all 52 flashcards in this deck.
Unlock Deck
k this deck
47
In general,the greater the proportion of variance accounted for,
A)the more error there is in the data.
B)the less accurately we can predict behavior.
C)the more accurately we can predict behavior.
D)the less important the relationship to our ability to make predictions.
A)the more error there is in the data.
B)the less accurately we can predict behavior.
C)the more accurately we can predict behavior.
D)the less important the relationship to our ability to make predictions.
Unlock Deck
Unlock for access to all 52 flashcards in this deck.
Unlock Deck
k this deck
48
A recent study of burnout among therapists shows a positive correlation of 0.53 between the number of clients a therapist is treating and the therapist's feelings of burnout.What proportion of the variance in feelings of burnout is accounted for by this relationship?
A)0.73
B)0.47
C)0.28
D)0.53
A)0.73
B)0.47
C)0.28
D)0.53
Unlock Deck
Unlock for access to all 52 flashcards in this deck.
Unlock Deck
k this deck
49
Compared to a strong relationship,a weak relationship between two variables results in
A)greater prediction error and a larger value of .
B)greater prediction error and a smaller value of .
C)less prediction error and a larger value of .
D)less prediction error and a smaller value of .
A)greater prediction error and a larger value of
.B)greater prediction error and a smaller value of
.C)less prediction error and a larger value of
.D)less prediction error and a smaller value of
. Unlock Deck
Unlock for access to all 52 flashcards in this deck.
Unlock Deck
k this deck
50
In the following study,researchers wanted to determine if a relationship existed between the minutes of light therapy a patient receives and the patient's reported score on a seasonal affective disorder (SAD)test.What is the proportion of variance not accounted for?
A)0.77
B)2.31
C)0.23
D)4.86
A)0.77
B)2.31
C)0.23
D)4.86
Unlock Deck
Unlock for access to all 52 flashcards in this deck.
Unlock Deck
k this deck
51
The coefficient of determination is equal to
A) .
B) .
C) .
D)
A)
.B)
.C)
.D)
Unlock Deck
Unlock for access to all 52 flashcards in this deck.
Unlock Deck
k this deck
52
When we divide the error remaining after we use the relationship to predict Y scores ( )by the total error when we use the mean to predict the Y scores ( )and then subtract the result from 1,the final result is the
A)proportion of variance not accounted for.
B)proportion of variance accounted for.
C)standard error of the estimate.
D)coefficient of alienation.
)by the total error when we use the mean to predict the Y scores ( )and then subtract the result from 1,the final result is theA)proportion of variance not accounted for.
B)proportion of variance accounted for.
C)standard error of the estimate.
D)coefficient of alienation.
Unlock Deck
Unlock for access to all 52 flashcards in this deck.
Unlock Deck
k this deck
Unlock Deck
Unlock for access to all 52 flashcards in this deck.


