Exam 8: Linear Regression
Exam 1: Introduction to Statistics43 Questions
Exam 2: Statistics and the Research Process75 Questions
Exam 3: Frequency Distributions and Percentiles48 Questions
Exam 4: Measures of Central Tendency;the Mean, median, and Mode62 Questions
Exam 5: Measures of Variability: Range, variance, and Standard Deviation59 Questions
Exam 6: Z-Scores and the Normal Curve60 Questions
Exam 7: The Correlation Coefficient52 Questions
Exam 8: Linear Regression52 Questions
Exam 9: Using Probability to Make Decisions About Data56 Questions
Exam 10: Introduction to Hypothesis Testing56 Questions
Exam 11: Performing the One-Sample T-Test and Testing Correlation Coefficients57 Questions
Exam 12: The Two-Sample T-Test65 Questions
Exam 13: The One-Way Analysis of Variance61 Questions
Exam 14: The Two-Way Analysis of Variance56 Questions
Exam 15: Chi Square and Other Nonparametric Procedures49 Questions
Select questions type
The Y-intercept is the value of  when X equals
Free
(Multiple Choice)
4.8/5  (33)
(33)
Correct Answer: Verified
B
The best-fitting line through a scatterplot is known as the ______ line.
Free
(Multiple Choice)
4.8/5 (32)
Correct Answer:Verified
D
Compared to a strong relationship,a weak relationship between two variables results in
Free
(Multiple Choice)
4.7/5 (33)
Correct Answer:Verified
A
Computing the standard error of the estimate (  )by subtracting each
  from the corresponding Y,squaring the difference,summing the results,dividing by N,and then taking the square root (the defining formula)is difficult and time-consuming.Fortunately,the same value can be computed by multiplying the standard deviation of Y (i.e. ,
  )by
)by
(Multiple Choice)
4.9/5 (34)
A nutrition major at State University was studying the relationship between carbohydrates (X)and calories (Y).For example,a serving of a particular brand of wheat pasta yielded 42 carbohydrates and 210 calories.After collecting X and Y data on many kinds of foods,the student determined the slope of the regression line to be 4.0 and the Y intercept to be 3.0.If a new food is tested,and the number of carbohydrates (X)is 100,what would be the predicted calories (  )?
)?
(Multiple Choice)
4.8/5 (29)
In a study of the relationship between amount of sugar consumed (X)and excitability (Y)in children,the regression equation was calculated to be 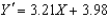 .The amount of sugar consumed ranged from 1 to 4 ounces.Which of the following graphs correctly displays the regression line?
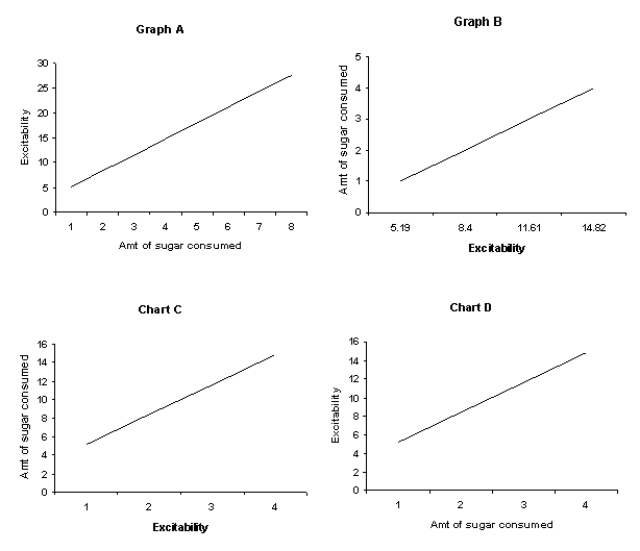
(Multiple Choice)
4.7/5 (36)
In the regression equation,the slope summarizes ______ and the Y-intercept indicates ______.
(Multiple Choice)
4.8/5 (39)
What is the Y-intercept of the following regression equation?  = -4.30X - 1.72
(Multiple Choice)
4.9/5 (34)
Which of the following formulas represents the Y intercept of the regression line?
(Multiple Choice)
4.9/5 (29)
When we divide the error remaining after we use the relationship to predict Y scores (  )by the total error when we use the mean to predict the Y scores (
  )and then subtract the result from 1,the final result is the
(Multiple Choice)
4.8/5 (32)
To predict a  score from a given X score using the regression equation,we would
(Multiple Choice)
4.9/5 (42)
If there is no relationship between two variables,the slope of the regression line will equal
(Multiple Choice)
4.9/5 (39)
For the following data,what is the predicted test score for a person with a stress level of 10? 
(Multiple Choice)
4.9/5 (25)
What is the Y-intercept of the following regression equation? 
(Multiple Choice)
4.9/5 (39)
If the correlation coefficient turns out to be a relatively high value,then the value of  will be
(Multiple Choice)
4.9/5 (32)
Filters
- Essay(0)
- Multiple Choice(0)
- Short Answer(0)
- True False(0)
- Matching(0)