Deck 12: Simple Regression
Full screen (f)
Question
Question
Question
Question
Question
Question
The ordinary least squares regression line always passes through the point  .
.
. Question
Question
Question
Question
Question
Question
Question
Question
Question
Question
Question
Question
Question
Question
Question
Question
Question
Question
Question
Question
Question
Question
Question
Question
Question
Question
Question
Question
Question
Question
Question
Question
Question
Question
Question
Question
Question
Question
Question
Question
Question
Question
Question
Question
Question
Question
Question
Question
Question
Question
Question
Question
Question
Question
Question
Question
Question
A researcher's results are shown below using Femlab (labor force participation rate among females)to try to predict Cancer (death rate per 100,000 population due to cancer)in the 50 U.S.states. 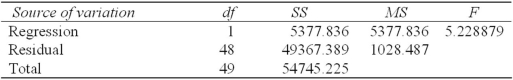 What is the R2 for this regression?
A) .9018
B) .0982
C) .8395
D) .1605
What is the R2 for this regression?A) .9018
B) .0982
C) .8395
D) .1605
Question
Question
Question
Question
Question
Question
Question
Question
Question
A local trucking company fitted a regression to relate the travel time (days)of its shipments as a function of the distance traveled (miles).The fitted regression is Time = -7.126 + 0.0214 Distance,based on a sample of 20 shipments.The estimated standard error of the slope is 0.0053.Find the value of tcalc to test for zero slope.
A) 2.46
B) 5.02
C) 4.04
D) 3.15
A) 2.46
B) 5.02
C) 4.04
D) 3.15
Question
Question
Question
Question
Question
A researcher's Excel results are shown below using Femlab (labor force participation rate among females)to try to predict Cancer (death rate per 100,000 population due to cancer)in the 50 U.S.states. 
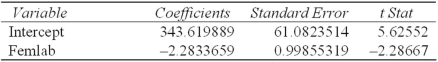 Which of the following statements is not true?
A) The standard error is too high for this model to be of any predictive use.
B) The 95 percent confidence interval for the coefficient of Femlab is -4.29 to -0.28.
C) Significant correlation exists between Femlab and Cancer at α = .05.
D) The two-tailed p-value for Femlab will be less than .05.
Which of the following statements is not true?A) The standard error is too high for this model to be of any predictive use.
B) The 95 percent confidence interval for the coefficient of Femlab is -4.29 to -0.28.
C) Significant correlation exists between Femlab and Cancer at α = .05.
D) The two-tailed p-value for Femlab will be less than .05.
Question
A researcher's results are shown below using Femlab (labor force participation rate among females)to try to predict Cancer (death rate per 100,000 population due to cancer)in the 50 U.S.states. 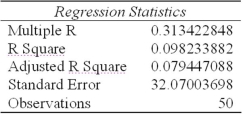
 Which statement is valid regarding the relationship between Femlab and Cancer?
A) A rise in female labor participation rate will cause the cancer rate to decrease within a state.
B) This model explains about 10 percent of the variation in state cancer rates.
C) At the .05 level of significance,there isn't enough evidence to say the two variables are related.
D) If your sister starts working,the cancer rate in your state will decline.
Which statement is valid regarding the relationship between Femlab and Cancer?A) A rise in female labor participation rate will cause the cancer rate to decrease within a state.
B) This model explains about 10 percent of the variation in state cancer rates.
C) At the .05 level of significance,there isn't enough evidence to say the two variables are related.
D) If your sister starts working,the cancer rate in your state will decline.
Question
Question

Unlock Deck
Sign up to unlock the cards in this deck!
Unlock Deck
Unlock Deck
1/120
Play
Full screen (f)
Deck 12: Simple Regression
1
The fitted intercept in a regression has little meaning if no data values near X = 0 have been observed.
True
2
The least squares regression line is obtained when the sum of the squared residuals is minimized.
True
3
If R2 = .36 in the model Sales = 268 + 7.37 Ads with n = 50,the two-tailed test for correlation at α = .05 would say that there is a significant correlation between Sales and Ads.
True
4
If R2 = .36 in the model Sales = 268 + 7.37 Ads,then Ads explains 36 percent of the variation in Sales.
Unlock Deck
Unlock for access to all 120 flashcards in this deck.
Unlock Deck
k this deck
5
If SSR is 1800 and SSE is 200,then R2 is .90.
Unlock Deck
Unlock for access to all 120 flashcards in this deck.
Unlock Deck
k this deck
6
The ordinary least squares regression line always passes through the point .
. Unlock Deck
Unlock for access to all 120 flashcards in this deck.
Unlock Deck
k this deck
7
In the model Sales = 268 + 7.37 Ads,an additional $1 spent on ads will increase sales by 7.37 percent.
Unlock Deck
Unlock for access to all 120 flashcards in this deck.
Unlock Deck
k this deck
8
A sample correlation r = .40 indicates a stronger linear relationship than r = -.60.
Unlock Deck
Unlock for access to all 120 flashcards in this deck.
Unlock Deck
k this deck
9
A common source of spurious correlation between X and Y is when a third unspecified variable Z affects both X and Y.
Unlock Deck
Unlock for access to all 120 flashcards in this deck.
Unlock Deck
k this deck
10
The correlation coefficient r measures the strength of the linear relationship between two variables.
Unlock Deck
Unlock for access to all 120 flashcards in this deck.
Unlock Deck
k this deck
11
A scatter plot is used to visualize the association (or lack of association)between two quantitative variables.
Unlock Deck
Unlock for access to all 120 flashcards in this deck.
Unlock Deck
k this deck
12
In a simple regression,if the coefficient for X is positive and significantly different from zero,then an increase in X is associated with an increase in the mean (i.e. ,the expected value)of Y.
Unlock Deck
Unlock for access to all 120 flashcards in this deck.
Unlock Deck
k this deck
13
In least-squares regression,the residuals e1,e2,... ,en will always have a zero mean.
Unlock Deck
Unlock for access to all 120 flashcards in this deck.
Unlock Deck
k this deck
14
Pearson's correlation coefficient (r)requires that both variables be interval or ratio data.
Unlock Deck
Unlock for access to all 120 flashcards in this deck.
Unlock Deck
k this deck
15
The correlation coefficient r always has the same sign as b1 in Y = b0 + b1X.
Unlock Deck
Unlock for access to all 120 flashcards in this deck.
Unlock Deck
k this deck
16
The least squares regression line gives unbiased estimates of β0 and β1.
Unlock Deck
Unlock for access to all 120 flashcards in this deck.
Unlock Deck
k this deck
17
In a simple regression,the correlation coefficient r is the square root of R2.
Unlock Deck
Unlock for access to all 120 flashcards in this deck.
Unlock Deck
k this deck
18
The width of a prediction interval for an individual value of Y is less than standard error se.
Unlock Deck
Unlock for access to all 120 flashcards in this deck.
Unlock Deck
k this deck
19
If r = .55 and n = 16,then the correlation is significant at α = .05 in a two-tailed test.
Unlock Deck
Unlock for access to all 120 flashcards in this deck.
Unlock Deck
k this deck
20
When using the least squares method,the column of residuals always sums to zero.
Unlock Deck
Unlock for access to all 120 flashcards in this deck.
Unlock Deck
k this deck
21
In linear regression between two variables,a significant relationship exists when the p-value of the t test statistic for the slope is greater than α.
Unlock Deck
Unlock for access to all 120 flashcards in this deck.
Unlock Deck
k this deck
22
The larger the absolute value of the t statistic of the slope in a simple linear regression,the stronger the linear relationship exists between X and Y.
Unlock Deck
Unlock for access to all 120 flashcards in this deck.
Unlock Deck
k this deck
23
"High leverage" would refer to a data point that is poorly predicted by the model (large residual).
Unlock Deck
Unlock for access to all 120 flashcards in this deck.
Unlock Deck
k this deck
24
The studentized residuals permit us to detect cases where the regression predicts poorly.
Unlock Deck
Unlock for access to all 120 flashcards in this deck.
Unlock Deck
k this deck
25
If you have a strong outlier in the residuals,it may represent a different causal system.
Unlock Deck
Unlock for access to all 120 flashcards in this deck.
Unlock Deck
k this deck
26
Ill-conditioned refers to a variable whose units are too large or too small .
Unlock Deck
Unlock for access to all 120 flashcards in this deck.
Unlock Deck
k this deck
27
In simple linear regression,the p-value of the slope will always equal the p-value of the F statistic.
Unlock Deck
Unlock for access to all 120 flashcards in this deck.
Unlock Deck
k this deck
28
Using the ordinary least squares method ensures that the residuals will be normally distributed.
Unlock Deck
Unlock for access to all 120 flashcards in this deck.
Unlock Deck
k this deck
29
The ordinary least squares method of estimation minimizes the estimated slope and intercept.
Unlock Deck
Unlock for access to all 120 flashcards in this deck.
Unlock Deck
k this deck
30
In simple linear regression,the coefficient of determination (R2)is estimated from sums of squares in the ANOVA table.
Unlock Deck
Unlock for access to all 120 flashcards in this deck.
Unlock Deck
k this deck
31
The total sum of squares (SST)will never exceed the regression sum of squares (SSR).
Unlock Deck
Unlock for access to all 120 flashcards in this deck.
Unlock Deck
k this deck
32
A poor prediction (large residual)indicates an observation with high leverage.
Unlock Deck
Unlock for access to all 120 flashcards in this deck.
Unlock Deck
k this deck
33
An observation with high leverage will have a large residual (usually an outlier).
Unlock Deck
Unlock for access to all 120 flashcards in this deck.
Unlock Deck
k this deck
34
If SSE is near zero in a regression,the statistician will conclude that the proposed model probably has too poor a fit to be useful.
Unlock Deck
Unlock for access to all 120 flashcards in this deck.
Unlock Deck
k this deck
35
Cause-and-effect direction between X and Y may be determined by running the regression twice and seeing whether Y = β0 + β1X or X = β1 + β0Y has the larger R2.
Unlock Deck
Unlock for access to all 120 flashcards in this deck.
Unlock Deck
k this deck
36
When X is farther from its mean,the prediction interval and confidence interval for Y become wider.
Unlock Deck
Unlock for access to all 120 flashcards in this deck.
Unlock Deck
k this deck
37
A prediction interval for Y is narrower than the corresponding confidence interval for the mean of Y.
Unlock Deck
Unlock for access to all 120 flashcards in this deck.
Unlock Deck
k this deck
38
A negative correlation between two variables X and Y usually yields a negative p-value for r.
Unlock Deck
Unlock for access to all 120 flashcards in this deck.
Unlock Deck
k this deck
39
For a regression with 200 observations,we expect that about 10 residuals will exceed two standard errors.
Unlock Deck
Unlock for access to all 120 flashcards in this deck.
Unlock Deck
k this deck
40
Confidence intervals for predicted Y are less precise when the residuals are very small.
Unlock Deck
Unlock for access to all 120 flashcards in this deck.
Unlock Deck
k this deck
41
A predictor that is significant in a one-tailed t-test will also be significant in a two-tailed test at the same level of significance α.
Unlock Deck
Unlock for access to all 120 flashcards in this deck.
Unlock Deck
k this deck
42
The regression line must pass through the origin.
Unlock Deck
Unlock for access to all 120 flashcards in this deck.
Unlock Deck
k this deck
43
The coefficient of determination is the percentage of the total variation in the response variable Y that is explained by the predictor X.
Unlock Deck
Unlock for access to all 120 flashcards in this deck.
Unlock Deck
k this deck
44
In a two-tailed test for correlation at α = .05,a sample correlation coefficient r = 0.42 with n = 25 is significantly different than zero.
Unlock Deck
Unlock for access to all 120 flashcards in this deck.
Unlock Deck
k this deck
45
A different confidence interval exists for the mean value of Y for each different value of X.
Unlock Deck
Unlock for access to all 120 flashcards in this deck.
Unlock Deck
k this deck
46
In a simple bivariate regression,Fcalc = tcalc2.
Unlock Deck
Unlock for access to all 120 flashcards in this deck.
Unlock Deck
k this deck
47
In correlation analysis,neither X nor Y is designated as the independent variable.
Unlock Deck
Unlock for access to all 120 flashcards in this deck.
Unlock Deck
k this deck
48
High leverage for an observation indicates that X is far from its mean.
Unlock Deck
Unlock for access to all 120 flashcards in this deck.
Unlock Deck
k this deck
49
A negative value for the correlation coefficient (r)implies a negative value for the slope (b1).
Unlock Deck
Unlock for access to all 120 flashcards in this deck.
Unlock Deck
k this deck
50
Autocorrelated errors are not usually a concern for regression models using cross-sectional data.
Unlock Deck
Unlock for access to all 120 flashcards in this deck.
Unlock Deck
k this deck
51
There are usually several possible regression lines that will minimize the sum of squared errors.
Unlock Deck
Unlock for access to all 120 flashcards in this deck.
Unlock Deck
k this deck
52
A simple decimal transformation often improves data conditioning.
Unlock Deck
Unlock for access to all 120 flashcards in this deck.
Unlock Deck
k this deck
53
In a simple regression,there are n - 2 degrees of freedom associated with the error sum of squares (SSE).
Unlock Deck
Unlock for access to all 120 flashcards in this deck.
Unlock Deck
k this deck
54
In a simple regression,the F statistic is calculated by taking the ratio of MSR to the MSE.
Unlock Deck
Unlock for access to all 120 flashcards in this deck.
Unlock Deck
k this deck
55
Two-tailed t-tests are often used because any predictor that differs significantly from zero in a two-tailed test will also be significantly greater than zero or less than zero in a one-tailed test at the same α.
Unlock Deck
Unlock for access to all 120 flashcards in this deck.
Unlock Deck
k this deck
56
Outliers can be detected by examining the standardized residuals.
Unlock Deck
Unlock for access to all 120 flashcards in this deck.
Unlock Deck
k this deck
57
A prediction interval for Y is widest when X is near its mean.
Unlock Deck
Unlock for access to all 120 flashcards in this deck.
Unlock Deck
k this deck
58
Omission of a relevant predictor is a common source of model misspecification.
Unlock Deck
Unlock for access to all 120 flashcards in this deck.
Unlock Deck
k this deck
59
When the errors in a regression model are not independent,the regression model is said to have autocorrelation.
Unlock Deck
Unlock for access to all 120 flashcards in this deck.
Unlock Deck
k this deck
60
Correlation analysis primarily measures the degree of the linear relationship between X and Y.
Unlock Deck
Unlock for access to all 120 flashcards in this deck.
Unlock Deck
k this deck
61
A local trucking company fitted a regression to relate the travel time (days)of its shipments as a function of the distance traveled (miles).The fitted regression is Time = -7.126 + .0214 Distance,based on a sample of 20 shipments.The estimated standard error of the slope is 0.0053.Find the critical value for a right-tailed test to see if the slope is positive,using α = .05.
A) 2.101
B) 2.552
C) 1.960
D) 1.734
A) 2.101
B) 2.552
C) 1.960
D) 1.734
Unlock Deck
Unlock for access to all 120 flashcards in this deck.
Unlock Deck
k this deck
62
If n = 15 and r = .4296,the corresponding t-statistic to test for zero correlation is:
A) 1.715.
B) 7.862.
C) 2.048.
D) impossible to determine without α.
A) 1.715.
B) 7.862.
C) 2.048.
D) impossible to determine without α.
Unlock Deck
Unlock for access to all 120 flashcards in this deck.
Unlock Deck
k this deck
63
A researcher's results are shown below using Femlab (labor force participation rate among females)to try to predict Cancer (death rate per 100,000 population due to cancer)in the 50 U.S.states. What is the R2 for this regression?
A) .9018
B) .0982
C) .8395
D) .1605
What is the R2 for this regression?A) .9018
B) .0982
C) .8395
D) .1605
Unlock Deck
Unlock for access to all 120 flashcards in this deck.
Unlock Deck
k this deck
64
The standard error of the regression:
A) is based on squared deviations from the regression line.
B) may assume negative values if b1 < 0.
C) is in squared units of the dependent variable.
D) may be cut in half to get an approximate 95 percent prediction interval.
A) is based on squared deviations from the regression line.
B) may assume negative values if b1 < 0.
C) is in squared units of the dependent variable.
D) may be cut in half to get an approximate 95 percent prediction interval.
Unlock Deck
Unlock for access to all 120 flashcards in this deck.
Unlock Deck
k this deck
65
Using a two-tailed test at α = .05 for n = 30,we would reject the hypothesis of zero correlation if the absolute value of r exceeds:
A) .2992.
B) .3609.
C) .0250.
D) .2004.
A) .2992.
B) .3609.
C) .0250.
D) .2004.
Unlock Deck
Unlock for access to all 120 flashcards in this deck.
Unlock Deck
k this deck
66
A hypothesis test is conducted at the 5 percent level of significance to test whether the population correlation is zero.If the sample consists of 25 observations and the correlation coefficient is 0.60,then the computed test statistic would be:
A) 2.071.
B) 1.960.
C) 3.597.
D) 1.645.
A) 2.071.
B) 1.960.
C) 3.597.
D) 1.645.
Unlock Deck
Unlock for access to all 120 flashcards in this deck.
Unlock Deck
k this deck
67
The ordinary least squares (OLS)method of estimation will minimize:
A) neither the slope nor the intercept.
B) only the slope.
C) only the intercept.
D) both the slope and intercept.
A) neither the slope nor the intercept.
B) only the slope.
C) only the intercept.
D) both the slope and intercept.
Unlock Deck
Unlock for access to all 120 flashcards in this deck.
Unlock Deck
k this deck
68
In a simple regression,which would suggest a significant relationship between X and Y?
A) Large p-value for the estimated slope
B) Large t statistic for the slope
C) Large p-value for the F statistic
D) Small t-statistic for the slope
A) Large p-value for the estimated slope
B) Large t statistic for the slope
C) Large p-value for the F statistic
D) Small t-statistic for the slope
Unlock Deck
Unlock for access to all 120 flashcards in this deck.
Unlock Deck
k this deck
69
If the attendance at a baseball game is to be predicted by the equation Attendance = 16,500 - 75 Temperature,what would be the predicted attendance if Temperature is 90 degrees?
A) 6,750
B) 9,750
C) 12,250
D) 10,020
A) 6,750
B) 9,750
C) 12,250
D) 10,020
Unlock Deck
Unlock for access to all 120 flashcards in this deck.
Unlock Deck
k this deck
70
Which is indicative of an inverse relationship between X and Y?
A) A negative F statistic
B) A negative p-value for the correlation coefficient
C) A negative correlation coefficient
D) Either a negative F statistic or a negative p-value
A) A negative F statistic
B) A negative p-value for the correlation coefficient
C) A negative correlation coefficient
D) Either a negative F statistic or a negative p-value
Unlock Deck
Unlock for access to all 120 flashcards in this deck.
Unlock Deck
k this deck
71
Which of the following is not a characteristic of the F-test in a simple regression?
A) It is a test for overall fit of the model.
B) The test statistic can never be negative.
C) It requires a table with numerator and denominator degrees of freedom.
D) The F-test gives a different p-value than the t-test.
A) It is a test for overall fit of the model.
B) The test statistic can never be negative.
C) It requires a table with numerator and denominator degrees of freedom.
D) The F-test gives a different p-value than the t-test.
Unlock Deck
Unlock for access to all 120 flashcards in this deck.
Unlock Deck
k this deck
72
A local trucking company fitted a regression to relate the travel time (days)of its shipments as a function of the distance traveled (miles).The fitted regression is Time = -7.126 + 0.0214 Distance,based on a sample of 20 shipments.The estimated standard error of the slope is 0.0053.Find the value of tcalc to test for zero slope.
A) 2.46
B) 5.02
C) 4.04
D) 3.15
A) 2.46
B) 5.02
C) 4.04
D) 3.15
Unlock Deck
Unlock for access to all 120 flashcards in this deck.
Unlock Deck
k this deck
73
William used a sample of 68 large U.S.cities to estimate the relationship between Crime (annual property crimes per 100,000 persons)and Income (median annual income per capita,in dollars).His estimated regression equation was Crime = 428 + 0.050 Income.We can conclude that:
A) the slope is small so Income has no effect on Crime.
B) crime seems to create additional income in a city.
C) wealthy individuals tend to commit more crimes,on average.
D) the intercept is irrelevant since zero median income is impossible in a large city.
A) the slope is small so Income has no effect on Crime.
B) crime seems to create additional income in a city.
C) wealthy individuals tend to commit more crimes,on average.
D) the intercept is irrelevant since zero median income is impossible in a large city.
Unlock Deck
Unlock for access to all 120 flashcards in this deck.
Unlock Deck
k this deck
74
A news network stated that a study had found a positive correlation between the number of children a worker has and his or her earnings last year.You may conclude that:
A) people should have more children so they can get better jobs.
B) the data are erroneous because the correlation should be negative.
C) causation is in serious doubt.
D) statisticians have small families.
A) people should have more children so they can get better jobs.
B) the data are erroneous because the correlation should be negative.
C) causation is in serious doubt.
D) statisticians have small families.
Unlock Deck
Unlock for access to all 120 flashcards in this deck.
Unlock Deck
k this deck
75
The variable used to predict another variable is called the:
A) response variable.
B) regression variable.
C) independent variable.
D) dependent variable.
A) response variable.
B) regression variable.
C) independent variable.
D) dependent variable.
Unlock Deck
Unlock for access to all 120 flashcards in this deck.
Unlock Deck
k this deck
76
Amelia used a random sample of 100 accounts receivable to estimate the relationship between Days (number of days from billing to receipt of payment)and Size (size of balance due in dollars).Her estimated regression equation was Days = 22 + 0.0047 Size with a correlation coefficient of .300.From this information we can conclude that:
A) 9 percent of the variation in Days is explained by Size.
B) autocorrelation is likely to be a problem.
C) the relationship between Days and Size is significant.
D) larger accounts usually take less time to pay.
A) 9 percent of the variation in Days is explained by Size.
B) autocorrelation is likely to be a problem.
C) the relationship between Days and Size is significant.
D) larger accounts usually take less time to pay.
Unlock Deck
Unlock for access to all 120 flashcards in this deck.
Unlock Deck
k this deck
77
A researcher's Excel results are shown below using Femlab (labor force participation rate among females)to try to predict Cancer (death rate per 100,000 population due to cancer)in the 50 U.S.states. Which of the following statements is not true?
A) The standard error is too high for this model to be of any predictive use.
B) The 95 percent confidence interval for the coefficient of Femlab is -4.29 to -0.28.
C) Significant correlation exists between Femlab and Cancer at α = .05.
D) The two-tailed p-value for Femlab will be less than .05.
Which of the following statements is not true?A) The standard error is too high for this model to be of any predictive use.
B) The 95 percent confidence interval for the coefficient of Femlab is -4.29 to -0.28.
C) Significant correlation exists between Femlab and Cancer at α = .05.
D) The two-tailed p-value for Femlab will be less than .05.
Unlock Deck
Unlock for access to all 120 flashcards in this deck.
Unlock Deck
k this deck
78
A researcher's results are shown below using Femlab (labor force participation rate among females)to try to predict Cancer (death rate per 100,000 population due to cancer)in the 50 U.S.states. Which statement is valid regarding the relationship between Femlab and Cancer?
A) A rise in female labor participation rate will cause the cancer rate to decrease within a state.
B) This model explains about 10 percent of the variation in state cancer rates.
C) At the .05 level of significance,there isn't enough evidence to say the two variables are related.
D) If your sister starts working,the cancer rate in your state will decline.
Which statement is valid regarding the relationship between Femlab and Cancer?A) A rise in female labor participation rate will cause the cancer rate to decrease within a state.
B) This model explains about 10 percent of the variation in state cancer rates.
C) At the .05 level of significance,there isn't enough evidence to say the two variables are related.
D) If your sister starts working,the cancer rate in your state will decline.
Unlock Deck
Unlock for access to all 120 flashcards in this deck.
Unlock Deck
k this deck
79
A standardized residual ei = -2.205 indicates:
A) a rather poor prediction.
B) an extreme outlier in the residuals.
C) an observation with high leverage.
D) a likely data entry error.
A) a rather poor prediction.
B) an extreme outlier in the residuals.
C) an observation with high leverage.
D) a likely data entry error.
Unlock Deck
Unlock for access to all 120 flashcards in this deck.
Unlock Deck
k this deck
80
Mary used a sample of 68 large U.S.cities to estimate the relationship between Crime (annual property crimes per 100,000 persons)and Income (median annual income per capita,in dollars).Her estimated regression equation was Crime = 428 + 0.050 Income.If Income decreases by 1000,we would expect that Crime will:
A) increase by 428.
B) decrease by 50.
C) increase by 500.
D) remain unchanged.
A) increase by 428.
B) decrease by 50.
C) increase by 500.
D) remain unchanged.
Unlock Deck
Unlock for access to all 120 flashcards in this deck.
Unlock Deck
k this deck
Unlock Deck
Unlock for access to all 120 flashcards in this deck.


