Exam 12: Simple Regression
Exam 1: Overview of Statistics50 Questions
Exam 2: Data Collection95 Questions
Exam 3: Describing Data Visually108 Questions
Exam 4: Descriptive Statistics134 Questions
Exam 5: Probability121 Questions
Exam 6: Discrete Probability Distributions127 Questions
Exam 7: Continuous Probability Distributions112 Questions
Exam 8: Sampling Distributions and Estimation99 Questions
Exam 9: One-Sample Hypothesis Tests136 Questions
Exam 10: Two-Sample Hypothesis Tests115 Questions
Exam 11: Analysis of Variance141 Questions
Exam 12: Simple Regression120 Questions
Exam 13: Multiple Regression111 Questions
Exam 14: Time-Series Analysis111 Questions
Exam 15: Chi-Square Tests94 Questions
Exam 16: Nonparametric Tests84 Questions
Exam 17: Quality Management103 Questions
Select questions type
Using the ordinary least squares method ensures that the residuals will be normally distributed.
Free
(True/False)
4.9/5  (30)
(30)
Correct Answer: Verified
False
In linear regression between two variables,a significant relationship exists when the p-value of the t test statistic for the slope is greater than α.
Free
(True/False)
4.8/5 (36)
Correct Answer:Verified
False
In a sample of n = 23,the critical value of the correlation coefficient for a two-tailed test at α = .05 is:
Free
(Multiple Choice)
4.7/5 (35)
Correct Answer:Verified
B
In a two-tailed test for correlation at α = .05,a sample correlation coefficient r = 0.42 with n = 25 is significantly different than zero.
(True/False)
4.7/5 (32)
The fitted intercept in a regression has little meaning if no data values near X = 0 have been observed.
(True/False)
4.9/5 (38)
Bob thinks there is something wrong with Excel's fitted regression.What do you say? 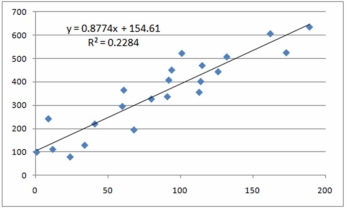
(Multiple Choice)
4.7/5 (43)
The least squares regression line is obtained when the sum of the squared residuals is minimized.
(True/False)
4.9/5 (34)
In a simple regression,there are n - 2 degrees of freedom associated with the error sum of squares (SSE).
(True/False)
4.9/5 (39)
The least squares regression line gives unbiased estimates of β0 and β1.
(True/False)
4.8/5 (35)
A scatter plot is used to visualize the association (or lack of association)between two quantitative variables.
(True/False)
4.9/5 (29)
In simple linear regression,the coefficient of determination (R2)is estimated from sums of squares in the ANOVA table.
(True/False)
4.8/5 (36)
The sample coefficient of correlation does not have which property?
(Multiple Choice)
4.9/5 (37)
A common source of spurious correlation between X and Y is when a third unspecified variable Z affects both X and Y.
(True/False)
4.9/5 (40)
Using a two-tailed test at α = .05 for n = 30,we would reject the hypothesis of zero correlation if the absolute value of r exceeds:
(Multiple Choice)
4.9/5 (34)
If r = .55 and n = 16,then the correlation is significant at α = .05 in a two-tailed test.
(True/False)
4.7/5 (33)
The width of a prediction interval for an individual value of Y is less than standard error se.
(True/False)
5.0/5 (36)
Find the sample correlation coefficient for the following data. 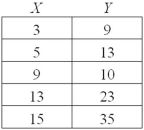
(Multiple Choice)
4.9/5 (34)
Filters
- Essay(0)
- Multiple Choice(0)
- Short Answer(0)
- True False(0)
- Matching(0)