Deck 9: Inference for Categorical Data
Full screen (f)
Question
Even though Puerto Rico is a commonwealth of the United States,there are many cultural differences between the states on the continent and the island of Puerto Rico.These differences include the way consumers handle problems with purchases.Two researchers surveyed owners of DVD players in the Northeast United States and in Puerto Rico.They asked those who had experienced problems with their DVD players whether they complained.The results are given in the table below.  The SPSS output for the above table is given below.The output includes the cell counts,the expected cell counts,and the chi-square statistic.Expected counts are printed below observed counts.
  Chi-square = 0.855 + 3.744 + 0.276 + 1.204 = 6.079 What proportion of Puerto Ricans did not complain?
A)0.063
B)0.26
C)0.34
D)0.516
The SPSS output for the above table is given below.The output includes the cell counts,the expected cell counts,and the chi-square statistic.Expected counts are printed below observed counts. Chi-square = 0.855 + 3.744 + 0.276 + 1.204 = 6.079 What proportion of Puerto Ricans did not complain?A)0.063
B)0.26
C)0.34
D)0.516
Question
Are avid readers more likely to wear glasses than those who read less frequently? Three hundred men in Ohio were selected at random and characterized as to whether they wore glasses and whether the amount of reading they did was above average,average,or below average.The results are presented in the following table. 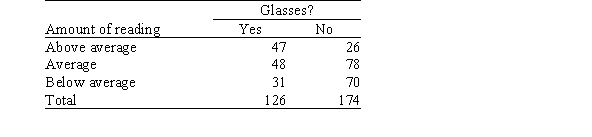 This is an r × c table.What is the value of the number r?
A)2
B)3
C)4
D)6
This is an r × c table.What is the value of the number r?A)2
B)3
C)4
D)6
Question
When a police officer responds to a call for help in a case of spousal abuse,what should the officer do? A randomized controlled experiment in Charlotte,North Carolina,studied three police responses to spousal abuse: advise and possibly separate the couple,issue a citation to the offender,and arrest the offender.The effectiveness of the three responses was determined by re-arrest rates.The table below shows these rates. 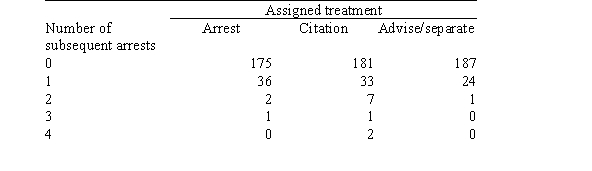 What is the proportion of all cases in which the assigned treatment was "Advise/separate"?
A)0.29
B)0.33
C)0.84
D)0.88
What is the proportion of all cases in which the assigned treatment was "Advise/separate"?A)0.29
B)0.33
C)0.84
D)0.88
Question
Even though Puerto Rico is a commonwealth of the United States,there are many cultural differences between the states on the continent and the island of Puerto Rico.These differences include the way consumers handle problems with purchases.Two researchers surveyed owners of DVD players in the Northeast United States and in Puerto Rico.They asked those who had experienced problems with their DVD players whether they complained.The results are given in the table below.  The SPSS output for the above table is given below.The output includes the cell counts,the expected cell counts,and the chi-square statistic.Expected counts are printed below observed counts.
 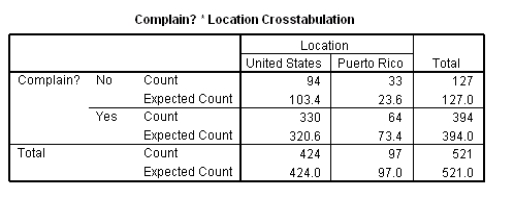 Chi-square = 0.855 + 3.744 + 0.276 + 1.204 = 6.079 What are the appropriate degrees of freedom for the chi-square statistic under the appropriate null hypotheis?
A)1
B)2
C)3
D)4
The SPSS output for the above table is given below.The output includes the cell counts,the expected cell counts,and the chi-square statistic.Expected counts are printed below observed counts. Chi-square = 0.855 + 3.744 + 0.276 + 1.204 = 6.079 What are the appropriate degrees of freedom for the chi-square statistic under the appropriate null hypotheis?A)1
B)2
C)3
D)4
Question
When a police officer responds to a call for help in a case of spousal abuse,what should the officer do? A randomized controlled experiment in Charlotte,North Carolina,studied three police responses to spousal abuse: advise and possibly separate the couple,issue a citation to the offender,and arrest the offender.The effectiveness of the three responses was determined by re-arrest rates.The table below shows these rates.  What proportion of times were there no subsequent arrests out of all cases in which the assigned treatment was "Advise/separate"?
A)0.29
B)0.33
C)0.84
D)0.88
What proportion of times were there no subsequent arrests out of all cases in which the assigned treatment was "Advise/separate"?A)0.29
B)0.33
C)0.84
D)0.88
Question
The 94 students in a statistics class are categorized by gender and by the year in school.The numbers obtained are displayed below. 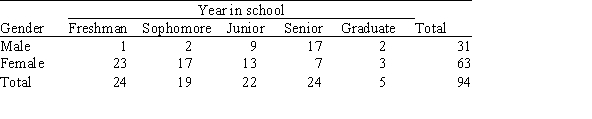 Suppose we wish to test the null hypothesis that there is no association between the year in school and gender.Under the null hypothesis,what is the expected number of male sophomores?
A)2
B)6
C)6.27
D)9.5
Suppose we wish to test the null hypothesis that there is no association between the year in school and gender.Under the null hypothesis,what is the expected number of male sophomores?A)2
B)6
C)6.27
D)9.5
Question
The following table provides the results of a study in a major hospital concerning patients and their supplemental health coverage.A random sample of 95 surgical patients showed that 36 had supplemental health coverage;in a second random sample of 125 medical patients,56 had coverage.  If we wanted to test for the equality of the proportion of patients of the two types that have supplemental health coverage (i.e. ,H0:
  against Ha:
  ),which of the following statements about the appropriate analysis (at the = 0.05 level)would be FALSE?
A)We could use a test with 1 degree of freedom.
B)We would reject the null hypothesis here if the observed | Z | > 1.96 or if > 3.84.
C)Both the z test and the test can be extended to test the equality of more than two proportions.
D)We could use a two-tailed z test for the equality of two proportions.
E)The test and the z test are equivalent because the square of the z statistic is equal to
 with 1 degree of freedom.
If we wanted to test for the equality of the proportion of patients of the two types that have supplemental health coverage (i.e. ,H0: against Ha: ),which of the following statements about the appropriate analysis (at the = 0.05 level)would be FALSE?A)We could use a
test with 1 degree of freedom.B)We would reject the null hypothesis here if the observed | Z | > 1.96 or if
> 3.84.C)Both the z test and the
test can be extended to test the equality of more than two proportions.D)We could use a two-tailed z test for the equality of two proportions.
E)The
test and the z test are equivalent because the square of the z statistic is equal to with 1 degree of freedom. Question
Even though Puerto Rico is a commonwealth of the United States,there are many cultural differences between the states on the continent and the island of Puerto Rico.These differences include the way consumers handle problems with purchases.Two researchers surveyed owners of DVD players in the Northeast United States and in Puerto Rico.They asked those who had experienced problems with their DVD players whether they complained.The results are given in the table below. 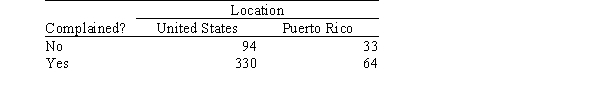 The SPSS output for the above table is given below.The output includes the cell counts,the expected cell counts,and the chi-square statistic.Expected counts are printed below observed counts.
  Chi-square = 0.855 + 3.744 + 0.276 + 1.204 = 6.079 What do we know about the P-value for testing the null hypothesis that the probability of complaining is the same for the United States and Puerto Rico?
A)P-value < 0.010
B)0.010 < P-value < 0.025
C)0.025 < P-value < 0.05
D)This cannot be determined because these are not the hypotheses being tested by the chi-square test.
The SPSS output for the above table is given below.The output includes the cell counts,the expected cell counts,and the chi-square statistic.Expected counts are printed below observed counts. Chi-square = 0.855 + 3.744 + 0.276 + 1.204 = 6.079 What do we know about the P-value for testing the null hypothesis that the probability of complaining is the same for the United States and Puerto Rico?A)P-value < 0.010
B)0.010 < P-value < 0.025
C)0.025 < P-value < 0.05
D)This cannot be determined because these are not the hypotheses being tested by the chi-square test.
Question
Television networks frequently run public opinion polls on issues of concern.One network conducted a scientific poll asking a question concerning the approval rating of the way President Obama was handling the Iraq War.At about the same time a second network ran an online poll using a very similar question.The results of the two polls are summarized in the following table. 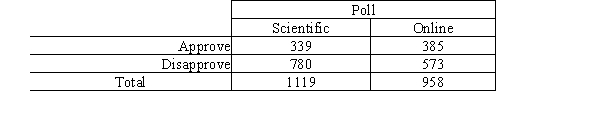 We would like to test to see if the two polls are consistent with respect to the proportion who approve of President Obama's handling of the war,i.e. ,H0:
  If the
  test is used to test the null hypothesis,the expected cell count in the online poll for those who approve and that cell's contribution to the value of the test statistic are,respectively,
A)390.1 and 7.70.
B)333.9 and 6.78.
C)390.1 and 6.69.
D)333.9 and 7.81.
E)362.0 and 1.46.
We would like to test to see if the two polls are consistent with respect to the proportion who approve of President Obama's handling of the war,i.e. ,H0: If the test is used to test the null hypothesis,the expected cell count in the online poll for those who approve and that cell's contribution to the value of the test statistic are,respectively,A)390.1 and 7.70.
B)333.9 and 6.78.
C)390.1 and 6.69.
D)333.9 and 7.81.
E)362.0 and 1.46.
Question
Which of the following statements about r × c tables is/are FALSE?
A)The null hypothesis is tested using the chi-square statistic with (r - 1)(c - 1)degrees of freedom.
B)The statistic used to test the null hypothesis is denoted by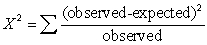 .
.
C)The P-value for the test is P( ),where
 is a random variable having the
 (df)distribution with df = (r - 1)(c - 1).
D)Under the null hypothesis the statistic has approximately a chi-square distribution with (r - 1)(c - 1)degrees of freedom.
E)The chi-square approximation is adequate when the average expected cell count is 5 or greater and all individual expected counts are 1 or greater,except in the case of 2 × 2 tables.
A)The null hypothesis is tested using the chi-square statistic with (r - 1)(c - 1)degrees of freedom.
B)The statistic used to test the null hypothesis is denoted by
.C)The P-value for the test is P(
),where is a random variable having the (df)distribution with df = (r - 1)(c - 1).D)Under the null hypothesis the
statistic has approximately a chi-square distribution with (r - 1)(c - 1)degrees of freedom.E)The chi-square approximation is adequate when the average expected cell count is 5 or greater and all individual expected counts are 1 or greater,except in the case of 2 × 2 tables.
Question
A review of voter registration records in a small town yielded the following table of the number of males and females registered as Democrat,Republican,or some other affiliation. 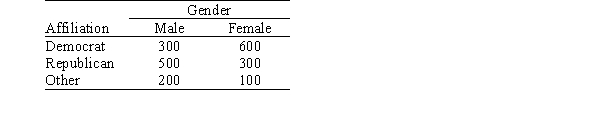 Suppose we wish to test the null hypothesis that there is no association between party affiliation and gender.Under the null hypothesis,what is the expected number of male Democrats?
A)300
B)333.3
C)450
D)500
Suppose we wish to test the null hypothesis that there is no association between party affiliation and gender.Under the null hypothesis,what is the expected number of male Democrats?A)300
B)333.3
C)450
D)500
Question
Even though Puerto Rico is a commonwealth of the United States,there are many cultural differences between the states on the continent and the island of Puerto Rico.These differences include the way consumers handle problems with purchases.Two researchers surveyed owners of DVD players in the Northeast United States and in Puerto Rico.They asked those who had experienced problems with their DVD players whether they complained.The results are given in the table below. 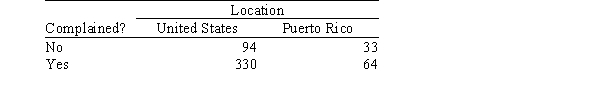 The SPSS output for the above table is given below.The output includes the cell counts,the expected cell counts,and the chi-square statistic.Expected counts are printed below observed counts.
  Chi-square = 0.855 + 3.744 + 0.276 + 1.204 = 6.079 Which cell contributes most to the chi-square statistic?
A)Americans in the United States who did not complain
B)Americans in the United States who complained
C)Puerto Ricans who did not complain
D)Puerto Ricans who did complain
The SPSS output for the above table is given below.The output includes the cell counts,the expected cell counts,and the chi-square statistic.Expected counts are printed below observed counts. Chi-square = 0.855 + 3.744 + 0.276 + 1.204 = 6.079 Which cell contributes most to the chi-square statistic?A)Americans in the United States who did not complain
B)Americans in the United States who complained
C)Puerto Ricans who did not complain
D)Puerto Ricans who did complain
Question
Which of the following statements about the analysis of two-way tables is/are TRUE?
A)Under the null hypothesis,the expected cell count is =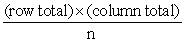 .
.
B)In a table with r rows and c columns,the number of degrees of freedom is (r - 1)(c - 1).
C)A possible null hypothesis is that there is no association between the row and column variables.
D)All of the above are true.
E)Only A and B are true.
A)Under the null hypothesis,the expected cell count is =
.B)In a table with r rows and c columns,the number of degrees of freedom is (r - 1)(c - 1).
C)A possible null hypothesis is that there is no association between the row and column variables.
D)All of the above are true.
E)Only A and B are true.
Question
Are avid readers more likely to wear glasses than those who read less frequently? Three hundred men in Ohio were selected at random and characterized as to whether they wore glasses and whether the amount of reading they did was above average,average,or below average.The results are presented in the following table.  Suppose we wish to test the null hypothesis that there is no association between the amount of reading and wearing glasses.Under the null hypothesis,what is the numerical value of the chi-square statistic?
A)2
B)8.65
C)21
D)30.7
Suppose we wish to test the null hypothesis that there is no association between the amount of reading and wearing glasses.Under the null hypothesis,what is the numerical value of the chi-square statistic?A)2
B)8.65
C)21
D)30.7
Question
Television networks frequently run public opinion polls on issues of concern.Recently one network conducted a scientific poll asking a question concerning the approval rating of the way President Obama was handling the Iraq War.At about the same time a second network ran an online poll using a very similar question.The results of the two polls are summarized in the following table. 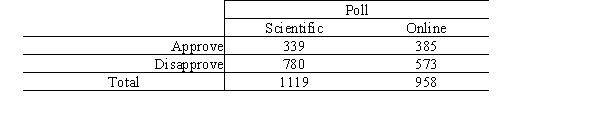 We would like to test to see if the two polls are consistent with respect to the proportion who approve of President Obama's handling of the war (i.e. ,H0:
  ). A statistic was calculated under the null hypothesis,which has the value 22.28.If the respondents in both polls can be considered to come from random samples,what is this statistic?
A)It is approximately a t with 1 degree of freedom.
B)It is a statistic with approximately a chi-square distribution with 3 degrees of freedom.
C)It is a statistic with an approximate chi-square distribution with 1 degree of freedom.
D)It is a z statistic.
E)It is none of the above.
We would like to test to see if the two polls are consistent with respect to the proportion who approve of President Obama's handling of the war (i.e. ,H0: ). A statistic was calculated under the null hypothesis,which has the value 22.28.If the respondents in both polls can be considered to come from random samples,what is this statistic?A)It is approximately a t with 1 degree of freedom.
B)It is a statistic with approximately a chi-square distribution with 3 degrees of freedom.
C)It is a statistic with an approximate chi-square distribution with 1 degree of freedom.
D)It is a z statistic.
E)It is none of the above.
Question
When a police officer responds to a call for help in a case of spousal abuse,what should the officer do? A randomized controlled experiment in Charlotte,North Carolina,studied three police responses to spousal abuse: advise and possibly separate the couple,issue a citation to the offender,and arrest the offender.The effectiveness of the three responses was determined by re-arrest rates.The table below shows these rates.  Suppose we wish to test the null hypothesis that the proportions of subsequent arrests are the same regardless of the treatment assigned.Under the null hypothesis,what is the expected number of times no subsequent arrest would occur for the treatment "Advise/separate"?
A)177
B)181
C)187
D)543
Suppose we wish to test the null hypothesis that the proportions of subsequent arrests are the same regardless of the treatment assigned.Under the null hypothesis,what is the expected number of times no subsequent arrest would occur for the treatment "Advise/separate"?A)177
B)181
C)187
D)543
Question
When a police officer responds to a call for help in a case of spousal abuse,what should the officer do? A randomized controlled experiment in Charlotte,North Carolina,studied three police responses to spousal abuse: advise and possibly separate the couple,issue a citation to the offender,and arrest the offender.The effectiveness of the three responses was determined by re-arrest rates.The table below shows these rates. 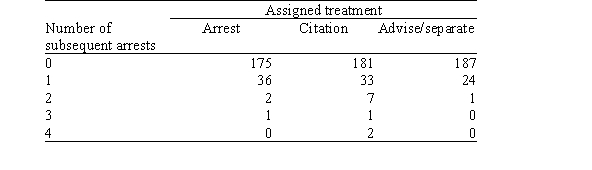 Suppose we wish to test the null hypothesis that the proportions of subsequent arrests are the same regardless of the treatment assigned.Which of the following statements is true?
A)We cannot test this hypothesis because the police officers did not record the expected counts.
B)The test of the null hypothesis will have a very small P-value (below 0.0001)because the counts in each row are not identical.
C)We cannot test this hypothesis because the expected cell counts are less than five in too many of the cells.
D)The test of the null hypothesis will have a very small P-value (below 0.0001)because there were so few cases where there was more than one re-arrest.
Suppose we wish to test the null hypothesis that the proportions of subsequent arrests are the same regardless of the treatment assigned.Which of the following statements is true?A)We cannot test this hypothesis because the police officers did not record the expected counts.
B)The test of the null hypothesis will have a very small P-value (below 0.0001)because the counts in each row are not identical.
C)We cannot test this hypothesis because the expected cell counts are less than five in too many of the cells.
D)The test of the null hypothesis will have a very small P-value (below 0.0001)because there were so few cases where there was more than one re-arrest.
Question
Even though Puerto Rico is a commonwealth of the United States,there are many cultural differences between the states on the continent and the island of Puerto Rico.These differences include the way consumers handle problems with purchases.Two researchers surveyed owners of DVD players in the Northeast United States and in Puerto Rico.They asked those who had experienced problems with their DVD players whether they complained.The results are given in the table below.  The SPSS output for the above table is given below.The output includes the cell counts,the expected cell counts,and the chi-square statistic.Expected counts are printed below observed counts.
  Chi-square = 0.855 + 3.744 + 0.276 + 1.204 = 6.079 What proportion of Americans did not complain?
A)0.18
B)0.194
C)0.22
D)0.74
The SPSS output for the above table is given below.The output includes the cell counts,the expected cell counts,and the chi-square statistic.Expected counts are printed below observed counts. Chi-square = 0.855 + 3.744 + 0.276 + 1.204 = 6.079 What proportion of Americans did not complain?A)0.18
B)0.194
C)0.22
D)0.74
Question
Are avid readers more likely to wear glasses than those who read less frequently? Three hundred men in Ohio were selected at random and characterized as to whether they wore glasses and whether the amount of reading they did was above average,average,or below average.The results are presented in the following table. 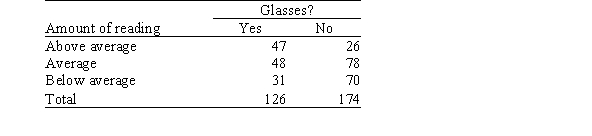 Suppose we wish to test the null hypothesis that there is no association between the amount of reading and wearing glasses.Under the null hypothesis,what is the expected number of above average readers who wear glasses?
A)27.2
B)30.7
C)47
D)81.1
Suppose we wish to test the null hypothesis that there is no association between the amount of reading and wearing glasses.Under the null hypothesis,what is the expected number of above average readers who wear glasses?A)27.2
B)30.7
C)47
D)81.1
Question
Prior to graduation,a high school class was surveyed about their plans after high school.The table below displays the results by gender. 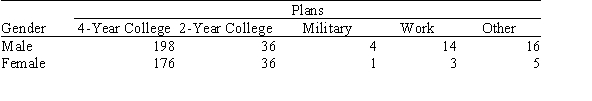 Suppose we wish to test the null hypothesis that there is no association between plans after high school and gender.Under the null hypothesis,what is the expected number of female students who are planning to work?
A)3
B)7.68
C)8.5
D)39.46
Suppose we wish to test the null hypothesis that there is no association between plans after high school and gender.Under the null hypothesis,what is the expected number of female students who are planning to work?A)3
B)7.68
C)8.5
D)39.46
Question
Question
Question
Question
Question
Question
Question
Question
Question
Question
Could mud wrestling be the cause of a rash contracted by University of Washington students in the spring of 1992? Two physicians at the University of Washington student health center wondered this when one male and six female students complained of rashes after participating in a mud-wrestling event.Questionnaires were sent to all students in the residence halls who participated in the event.The questionnaire asked about the appearance of a rash and about attendance at the mud-wrestling event.The results,by gender,are summarized in the following table. 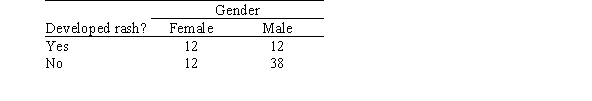 The SPSS output for the above table is given below.The output includes the cell counts,the expected cell counts,the chi-square statistic,and its degrees of freedom.Expected counts are printed below observed counts.
  Chi-square = 2.289 + 1.098 + 1.098 + 0.527 = 5.002 df = 1,P-value = 0.0253
Which cell contributes most to the chi-square statistic?
A)Men who developed a rash
B)Men who did not develop a rash
C)Women who developed a rash
D)Women who did not develop a rash
The SPSS output for the above table is given below.The output includes the cell counts,the expected cell counts,the chi-square statistic,and its degrees of freedom.Expected counts are printed below observed counts. Chi-square = 2.289 + 1.098 + 1.098 + 0.527 = 5.002 df = 1,P-value = 0.0253Which cell contributes most to the chi-square statistic?
A)Men who developed a rash
B)Men who did not develop a rash
C)Women who developed a rash
D)Women who did not develop a rash
Question
Question
Question
Question
Question
Question
Question
Question
Question
Could mud wrestling be the cause of a rash contracted by University of Washington students in the spring of 1992? Two physicians at the University of Washington student health center wondered this when one male and six female students complained of rashes after participating in a mud-wrestling event.Questionnaires were sent to all students in the residence halls who participated in the event.The questionnaire asked about the appearance of a rash and about attendance at the mud-wrestling event.The results,by gender,are summarized in the following table.  The SPSS output for the above table is given below.The output includes the cell counts,the expected cell counts,the chi-square statistic,and its degrees of freedom.Expected counts are printed below observed counts.
 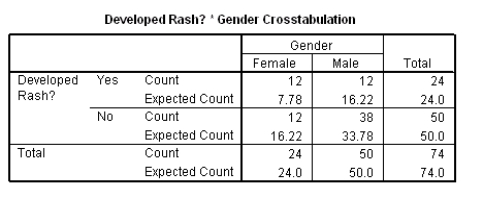 Chi-square = 2.289 + 1.098 + 1.098 + 0.527 = 5.002 df = 1,P-value = 0.0253
What conclusion can we draw from the above tables at the 5% significance level?
A)There appears to be evidence of an association between the gender of an individual attending the event and development of a rash.
B)Mud wrestling causes a rash,especially for women.
C)There is absolutely no evidence of any relationship between the gender of an individual attending the event and the subsequent development of a rash.
D)Development of a rash is a real possibility if you attend mud-wrestling events,especially if you attend them on a regular basis.
The SPSS output for the above table is given below.The output includes the cell counts,the expected cell counts,the chi-square statistic,and its degrees of freedom.Expected counts are printed below observed counts. Chi-square = 2.289 + 1.098 + 1.098 + 0.527 = 5.002 df = 1,P-value = 0.0253What conclusion can we draw from the above tables at the 5% significance level?
A)There appears to be evidence of an association between the gender of an individual attending the event and development of a rash.
B)Mud wrestling causes a rash,especially for women.
C)There is absolutely no evidence of any relationship between the gender of an individual attending the event and the subsequent development of a rash.
D)Development of a rash is a real possibility if you attend mud-wrestling events,especially if you attend them on a regular basis.
Question
Question
Question
Question
Because statistical software plays such an important role in modern statistical applications,many studies have encouraged the use of technology in statistics courses.The Guidelines for the Assessment and Instruction in Statistics Education (GAISE)(Aliaga et al. ,2005)project was funded by the American Statistical Association to examine needs for college level statistics courses.One of the six recommendations from GAISE is the use of technology for developing conceptual understanding and analyzing data.A survey was sent to students at 100 different universities across the United States to access the relationship between ease of learning the statistical software program SAS and a student's currently level of SAS proficiency.The results of the survey are published in Jackson et al. ,2011,in the International Mathematical Forum journal and are shown below. Table 1.Two-way table for ease of learning SAS and SAS proficiency level. 
 What is the column proportion,B,for students who find SAS somewhat easy to learn and who are not proficient in SAS?
A)8/52
B)8/20
C)20/112
D)None of the above
What is the column proportion,B,for students who find SAS somewhat easy to learn and who are not proficient in SAS?A)8/52
B)8/20
C)20/112
D)None of the above
Question
Because statistical software plays such an important role in modern statistical applications,many studies have encouraged the use of technology in statistics courses.The Guidelines for the Assessment and Instruction in Statistics Education (GAISE)(Aliaga et al. ,2005)project was funded by the American Statistical Association to examine needs for college level statistics courses.One of the six recommendations from GAISE is the use of technology for developing conceptual understanding and analyzing data.A survey was sent to students at 100 different universities across the United States to access the relationship between ease of learning the statistical software program SAS and a student's currently level of SAS proficiency.The results of the survey are published in Jackson et al. ,2011,in the International Mathematical Forum journal and are shown below. Table 1.Two-way table for ease of learning SAS and SAS proficiency level. 
 Which graph displays the correct distribution for comparing "very easy" ease of learning SAS and "very proficient" proficiency?
A)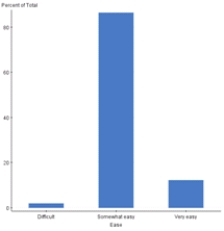
B)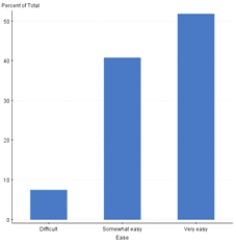
C)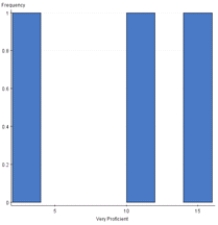
D)None of the above
Which graph displays the correct distribution for comparing "very easy" ease of learning SAS and "very proficient" proficiency?A)
B)
C)
D)None of the above
Question
Because statistical software plays such an important role in modern statistical applications,many studies have encouraged the use of technology in statistics courses.The Guidelines for the Assessment and Instruction in Statistics Education (GAISE)(Aliaga et al. ,2005)project was funded by the American Statistical Association to examine needs for college level statistics courses.One of the six recommendations from GAISE is the use of technology for developing conceptual understanding and analyzing data.A survey was sent to students at 100 different universities across the United States to access the relationship between ease of learning the statistical software program SAS and a student's currently level of SAS proficiency.The results of the survey are published in Jackson et al. ,2011,in the International Mathematical Forum journal and are shown below. Table 1.Two-way table for ease of learning SAS and SAS proficiency level. 
 How many students were involved in the study?
A)65
B)27
C)112
D)None of the above
How many students were involved in the study?A)65
B)27
C)112
D)None of the above
Question
Because statistical software plays such an important role in modern statistical applications,many studies have encouraged the use of technology in statistics courses.The Guidelines for the Assessment and Instruction in Statistics Education (GAISE)(Aliaga et al. ,2005)project was funded by the American Statistical Association to examine needs for college level statistics courses.One of the six recommendations from GAISE is the use of technology for developing conceptual understanding and analyzing data.A survey was sent to students at 100 different universities across the United States to access the relationship between ease of learning the statistical software program SAS and a student's currently level of SAS proficiency.The results of the survey are published in Jackson et al. ,2011,in the International Mathematical Forum journal and are shown below. Table 1.Two-way table for ease of learning SAS and SAS proficiency level. 
 What is the column proportion,A,for students who find SAS difficult to learn and who are not proficient in SAS?
A)11/20
B)11/28
C)11/112
D)None of the above
What is the column proportion,A,for students who find SAS difficult to learn and who are not proficient in SAS?A)11/20
B)11/28
C)11/112
D)None of the above
Question
Because statistical software plays such an important role in modern statistical applications,many studies have encouraged the use of technology in statistics courses.The Guidelines for the Assessment and Instruction in Statistics Education (GAISE)(Aliaga et al. ,2005)project was funded by the American Statistical Association to examine needs for college level statistics courses.One of the six recommendations from GAISE is the use of technology for developing conceptual understanding and analyzing data.A survey was sent to students at 100 different universities across the United States to access the relationship between ease of learning the statistical software program SAS and a student's currently level of SAS proficiency.The results of the survey are published in Jackson et al. ,2011,in the International Mathematical Forum journal and are shown below. Table 1.Two-way table for ease of learning SAS and SAS proficiency level. 
 What is the column proportion,G,for students who find SAS difficult to learn and who are very proficient in SAS?
A)27/112
B)2/112
C)2/28
D)None of the above
What is the column proportion,G,for students who find SAS difficult to learn and who are very proficient in SAS?A)27/112
B)2/112
C)2/28
D)None of the above
Question
Because statistical software plays such an important role in modern statistical applications,many studies have encouraged the use of technology in statistics courses.The Guidelines for the Assessment and Instruction in Statistics Education (GAISE)(Aliaga et al. ,2005)project was funded by the American Statistical Association to examine needs for college level statistics courses.One of the six recommendations from GAISE is the use of technology for developing conceptual understanding and analyzing data.A survey was sent to students at 100 different universities across the United States to access the relationship between ease of learning the statistical software program SAS and a student's currently level of SAS proficiency.The results of the survey are published in Jackson et al. ,2011,in the International Mathematical Forum journal and are shown below. Table 1.Two-way table for ease of learning SAS and SAS proficiency level. 
 What is the value of K?
A)52
B)52/112
C)100
D)None of the above
What is the value of K?A)52
B)52/112
C)100
D)None of the above
Question
Because statistical software plays such an important role in modern statistical applications,many studies have encouraged the use of technology in statistics courses.The Guidelines for the Assessment and Instruction in Statistics Education (GAISE)(Aliaga et al. ,2005)project was funded by the American Statistical Association to examine needs for college level statistics courses.One of the six recommendations from GAISE is the use of technology for developing conceptual understanding and analyzing data.A survey was sent to students at 100 different universities across the United States to access the relationship between ease of learning the statistical software program SAS and a student's currently level of SAS proficiency.The results of the survey are published in Jackson et al. ,2011,in the International Mathematical Forum journal and are shown below. Table 1.Two-way table for ease of learning SAS and SAS proficiency level. 
 Which graph displays the correct distribution for comparing "very easy" ease of learning SAS and "not proficient" proficiency?
A)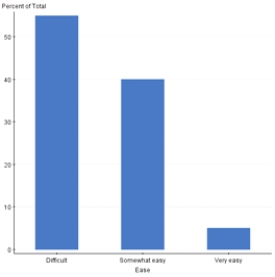
B)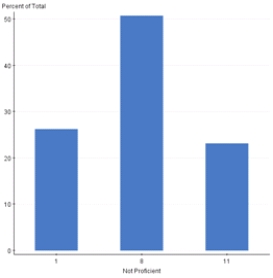
C)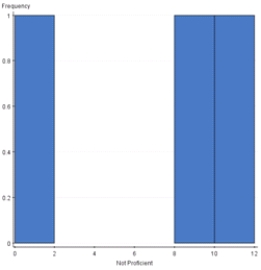
D)None of the above
Which graph displays the correct distribution for comparing "very easy" ease of learning SAS and "not proficient" proficiency?A)
B)
C)
D)None of the above
Question
Because statistical software plays such an important role in modern statistical applications,many studies have encouraged the use of technology in statistics courses.The Guidelines for the Assessment and Instruction in Statistics Education (GAISE)(Aliaga et al. ,2005)project was funded by the American Statistical Association to examine needs for college level statistics courses.One of the six recommendations from GAISE is the use of technology for developing conceptual understanding and analyzing data.A survey was sent to students at 100 different universities across the United States to access the relationship between ease of learning the statistical software program SAS and a student's currently level of SAS proficiency.The results of the survey are published in Jackson et al. ,2011,in the International Mathematical Forum journal and are shown below. Table 1.Two-way table for ease of learning SAS and SAS proficiency level. 
 What is the column proportion,F,for students who find SAS very easy to learn and who are somewhat proficient in SAS?
A)17/65
B)17/32
C)17/112
D)None of the above
What is the column proportion,F,for students who find SAS very easy to learn and who are somewhat proficient in SAS?A)17/65
B)17/32
C)17/112
D)None of the above
Question
Because statistical software plays such an important role in modern statistical applications,many studies have encouraged the use of technology in statistics courses.The Guidelines for the Assessment and Instruction in Statistics Education (GAISE)(Aliaga et al. ,2005)project was funded by the American Statistical Association to examine needs for college level statistics courses.One of the six recommendations from GAISE is the use of technology for developing conceptual understanding and analyzing data.A survey was sent to students at 100 different universities across the United States to access the relationship between ease of learning the statistical software program SAS and a student's currently level of SAS proficiency.The results of the survey are published in Jackson et al. ,2011,in the International Mathematical Forum journal and are shown below. Table 1.Two-way table for ease of learning SAS and SAS proficiency level. 
 The letters J,K,and L represent the ______ distribution for ease of learning SAS.
A)conditional
B)marginal
C)joint
D)2
The letters J,K,and L represent the ______ distribution for ease of learning SAS.A)conditional
B)marginal
C)joint
D)2
Question
Because statistical software plays such an important role in modern statistical applications,many studies have encouraged the use of technology in statistics courses.The Guidelines for the Assessment and Instruction in Statistics Education (GAISE)(Aliaga et al. ,2005)project was funded by the American Statistical Association to examine needs for college level statistics courses.One of the six recommendations from GAISE is the use of technology for developing conceptual understanding and analyzing data.A survey was sent to students at 100 different universities across the United States to access the relationship between ease of learning the statistical software program SAS and a student's currently level of SAS proficiency.The results of the survey are published in Jackson et al. ,2011,in the International Mathematical Forum journal and are shown below. Table 1.Two-way table for ease of learning SAS and SAS proficiency level. 
 What is the value of J?
A)28
B)28/112
C)100
D)None of the above
What is the value of J?A)28
B)28/112
C)100
D)None of the above
Question
Because statistical software plays such an important role in modern statistical applications,many studies have encouraged the use of technology in statistics courses.The Guidelines for the Assessment and Instruction in Statistics Education (GAISE)(Aliaga et al. ,2005)project was funded by the American Statistical Association to examine needs for college level statistics courses.One of the six recommendations from GAISE is the use of technology for developing conceptual understanding and analyzing data.A survey was sent to students at 100 different universities across the United States to access the relationship between ease of learning the statistical software program SAS and a student's currently level of SAS proficiency.The results of the survey are published in Jackson et al. ,2011,in the International Mathematical Forum journal and are shown below. Table 1.Two-way table for ease of learning SAS and SAS proficiency level. 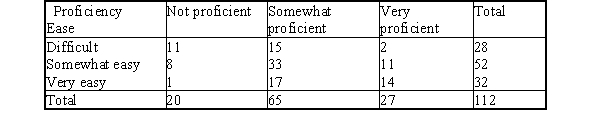
 What is the column proportion,C,for students who find SAS very easy to learn and who are not proficient in SAS?
A)1/20
B)1/32
C)2/112
D)None of the above
What is the column proportion,C,for students who find SAS very easy to learn and who are not proficient in SAS?A)1/20
B)1/32
C)2/112
D)None of the above
Question
Because statistical software plays such an important role in modern statistical applications,many studies have encouraged the use of technology in statistics courses.The Guidelines for the Assessment and Instruction in Statistics Education (GAISE)(Aliaga et al. ,2005)project was funded by the American Statistical Association to examine needs for college level statistics courses.One of the six recommendations from GAISE is the use of technology for developing conceptual understanding and analyzing data.A survey was sent to students at 100 different universities across the United States to access the relationship between ease of learning the statistical software program SAS and a student's currently level of SAS proficiency.The results of the survey are published in Jackson et al. ,2011,in the International Mathematical Forum journal and are shown below. Table 1.Two-way table for ease of learning SAS and SAS proficiency level. 
 What size table is shown above?
A)3 × 3
B)4 × 4
C)4 × 3
D)None of the above
What size table is shown above?A)3 × 3
B)4 × 4
C)4 × 3
D)None of the above
Question
Because statistical software plays such an important role in modern statistical applications,many studies have encouraged the use of technology in statistics courses.The Guidelines for the Assessment and Instruction in Statistics Education (GAISE)(Aliaga et al. ,2005)project was funded by the American Statistical Association to examine needs for college level statistics courses.One of the six recommendations from GAISE is the use of technology for developing conceptual understanding and analyzing data.A survey was sent to students at 100 different universities across the United States to access the relationship between ease of learning the statistical software program SAS and a student's currently level of SAS proficiency.The results of the survey are published in Jackson et al. ,2011,in the International Mathematical Forum journal and are shown below. Table 1.Two-way table for ease of learning SAS and SAS proficiency level. 
 What is the column proportion,I,for students who find SAS very easy to learn and who are very proficient in SAS?
A)14/32
B)27/112
C)14/27
D)None of the above
What is the column proportion,I,for students who find SAS very easy to learn and who are very proficient in SAS?A)14/32
B)27/112
C)14/27
D)None of the above
Question
Because statistical software plays such an important role in modern statistical applications,many studies have encouraged the use of technology in statistics courses.The Guidelines for the Assessment and Instruction in Statistics Education (GAISE)(Aliaga et al. ,2005)project was funded by the American Statistical Association to examine needs for college level statistics courses.One of the six recommendations from GAISE is the use of technology for developing conceptual understanding and analyzing data.A survey was sent to students at 100 different universities across the United States to access the relationship between ease of learning the statistical software program SAS and a student's currently level of SAS proficiency.The results of the survey are published in Jackson et al. ,2011,in the International Mathematical Forum journal and are shown below. Table 1.Two-way table for ease of learning SAS and SAS proficiency level. 
 What is the column proportion,H,for students who find SAS somewhat easy to learn and who are very proficient in SAS?
A)11/27
B)11/52
C)11/112
D)None of the above
What is the column proportion,H,for students who find SAS somewhat easy to learn and who are very proficient in SAS?A)11/27
B)11/52
C)11/112
D)None of the above
Question
Because statistical software plays such an important role in modern statistical applications,many studies have encouraged the use of technology in statistics courses.The Guidelines for the Assessment and Instruction in Statistics Education (GAISE)(Aliaga et al. ,2005)project was funded by the American Statistical Association to examine needs for college level statistics courses.One of the six recommendations from GAISE is the use of technology for developing conceptual understanding and analyzing data.A survey was sent to students at 100 different universities across the United States to access the relationship between ease of learning the statistical software program SAS and a student's currently level of SAS proficiency.The results of the survey are published in Jackson et al. ,2011,in the International Mathematical Forum journal and are shown below. Table 1.Two-way table for ease of learning SAS and SAS proficiency level. 
 What is the column proportion,D,for students who find SAS difficult to learn and who are somewhat proficient in SAS?
A)15/65
B)15/28
C)15/112
D)None of the above
What is the column proportion,D,for students who find SAS difficult to learn and who are somewhat proficient in SAS?A)15/65
B)15/28
C)15/112
D)None of the above
Question
Because statistical software plays such an important role in modern statistical applications,many studies have encouraged the use of technology in statistics courses.The Guidelines for the Assessment and Instruction in Statistics Education (GAISE)(Aliaga et al. ,2005)project was funded by the American Statistical Association to examine needs for college level statistics courses.One of the six recommendations from GAISE is the use of technology for developing conceptual understanding and analyzing data.A survey was sent to students at 100 different universities across the United States to access the relationship between ease of learning the statistical software program SAS and a student's currently level of SAS proficiency.The results of the survey are published in Jackson et al. ,2011,in the International Mathematical Forum journal and are shown below. Table 1.Two-way table for ease of learning SAS and SAS proficiency level. 
 Which graph displays the correct distribution for comparing "very easy" ease of learning SAS and "somewhat proficient" proficiency?
A)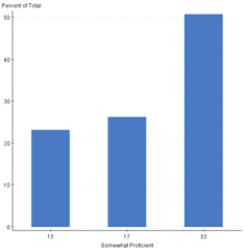
B)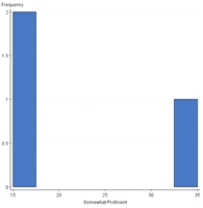
C)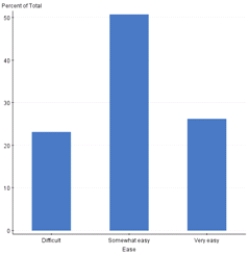
D)None of the above
Which graph displays the correct distribution for comparing "very easy" ease of learning SAS and "somewhat proficient" proficiency?A)
B)
C)
D)None of the above
Question
Because statistical software plays such an important role in modern statistical applications,many studies have encouraged the use of technology in statistics courses.The Guidelines for the Assessment and Instruction in Statistics Education (GAISE)(Aliaga et al. ,2005)project was funded by the American Statistical Association to examine needs for college level statistics courses.One of the six recommendations from GAISE is the use of technology for developing conceptual understanding and analyzing data.A survey was sent to students at 100 different universities across the United States to access the relationship between ease of learning the statistical software program SAS and a student's currently level of SAS proficiency.The results of the survey are published in Jackson et al. ,2011,in the International Mathematical Forum journal and are shown below. Table 1.Two-way table for ease of learning SAS and SAS proficiency level. 
 What is the value of L?
A)112
B)100/112
C)32/100
D)None of the above
What is the value of L?A)112
B)100/112
C)32/100
D)None of the above
Question
Because statistical software plays such an important role in modern statistical applications,many studies have encouraged the use of technology in statistics courses.The Guidelines for the Assessment and Instruction in Statistics Education (GAISE)(Aliaga et al. ,2005)project was funded by the American Statistical Association to examine needs for college level statistics courses.One of the six recommendations from GAISE is the use of technology for developing conceptual understanding and analyzing data.A survey was sent to students at 100 different universities across the United States to access the relationship between ease of learning the statistical software program SAS and a student's currently level of SAS proficiency.The results of the survey are published in Jackson et al. ,2011,in the International Mathematical Forum journal and are shown below. Table 1.Two-way table for ease of learning SAS and SAS proficiency level. 
 What is the column proportion,E,for students who find SAS somewhat easy to learn and who are somewhat proficient in SAS?
A)15/2
B)33/11
C)17/112
D)None of the above
What is the column proportion,E,for students who find SAS somewhat easy to learn and who are somewhat proficient in SAS?A)15/2
B)33/11
C)17/112
D)None of the above
Question
Because statistical software plays such an important role in modern statistical applications,many studies have encouraged the use of technology in statistics courses.The Guidelines for the Assessment and Instruction in Statistics Education (GAISE)(Aliaga et al. ,2005)project was funded by the American Statistical Association to examine needs for college level statistics courses.One of the six recommendations from GAISE is the use of technology for developing conceptual understanding and analyzing data.A survey was sent to students at 100 different universities across the United States to access the relationship between ease of learning the statistical software program SAS and a student's currently level of SAS proficiency.The results of the survey are published in Jackson et al. ,2011,in the International Mathematical Forum journal and are shown below. Table 1.Two-way table for ease of learning SAS and SAS proficiency level. 
 What is the first contribution to the 2 statistic for the significance test to test for a relationship between ease of learning SAS and SAS proficiency based on the location of cell A?
A)6
B)11
C)7.2
D)None of the above
What is the first contribution to the 2 statistic for the significance test to test for a relationship between ease of learning SAS and SAS proficiency based on the location of cell A?A)6
B)11
C)7.2
D)None of the above
Question
The Poisson distribution is a discrete distribution that expresses the probability of a fixed number of events occurring in a fixed interval.For example,suppose we want to model the number of arrivals per minute at the campus dining hall during lunch.We observe the actual arrivals in 200 one-minute periods in 1 week.The sample mean is 3.8 and the results are shown below.  The probabilities based on a Poisson distribution with a mean of 3.8 are shown below.
  What is the value of the first contribution to the chi-square statistic for the goodness-of-fit test to the Poisson distribution using the expected count for 0 arrivals?
A)9
B)10
C)200
D)None of the above
The probabilities based on a Poisson distribution with a mean of 3.8 are shown below. What is the value of the first contribution to the chi-square statistic for the goodness-of-fit test to the Poisson distribution using the expected count for 0 arrivals?A)9
B)10
C)200
D)None of the above
Question
Because statistical software plays such an important role in modern statistical applications,many studies have encouraged the use of technology in statistics courses.The Guidelines for the Assessment and Instruction in Statistics Education (GAISE)(Aliaga et al. ,2005)project was funded by the American Statistical Association to examine needs for college level statistics courses.One of the six recommendations from GAISE is the use of technology for developing conceptual understanding and analyzing data.A survey was sent to students at 100 different universities across the United States to access the relationship between ease of learning the statistical software program SAS and a student's currently level of SAS proficiency.The results of the survey are published in Jackson et al. ,2011,in the International Mathematical Forum journal and are shown below. Table 1.Two-way table for ease of learning SAS and SAS proficiency level. 
 What is the expected cell count for students who find SAS difficult to learn and who are not proficient?
A)5
B)1
C)11
D)None of the above
What is the expected cell count for students who find SAS difficult to learn and who are not proficient?A)5
B)1
C)11
D)None of the above
Question
Question
Because statistical software plays such an important role in modern statistical applications,many studies have encouraged the use of technology in statistics courses.The Guidelines for the Assessment and Instruction in Statistics Education (GAISE)(Aliaga et al. ,2005)project was funded by the American Statistical Association to examine needs for college level statistics courses.One of the six recommendations from GAISE is the use of technology for developing conceptual understanding and analyzing data.A survey was sent to students at 100 different universities across the United States to access the relationship between ease of learning the statistical software program SAS and a student's currently level of SAS proficiency.The results of the survey are published in Jackson et al. ,2011,in the International Mathematical Forum journal and are shown below. Table 1.Two-way table for ease of learning SAS and SAS proficiency level. 
 What is the expected cell count for students who find SAS somewhat easy to learn and who are not proficient?
A)20
B)8
C)9.3
D)None of the above
What is the expected cell count for students who find SAS somewhat easy to learn and who are not proficient?A)20
B)8
C)9.3
D)None of the above
Question
Question
A study was performed to examine the personal goals of children in grades 4,5,and 6.A random sample of students was selected from each of the grades 4,5,and 6 from schools in Georgia.The students received a questionnaire regarding achieving personal goals.They were asked what they would most like to do at school: make good grades,be good at sports,or be popular.Results are presented by the gender of the child in the table below.  What is the value of the chi-square statistic based on the data presented in this table under the appropriate null hypothesis?
A)3.84
B)5.99
C)16.105
D)89.966
What is the value of the chi-square statistic based on the data presented in this table under the appropriate null hypothesis?A)3.84
B)5.99
C)16.105
D)89.966
Question
Question
Question
The Poisson distribution is a discrete distribution that expresses the probability of a fixed number of events occurring in a fixed interval.For example,suppose we want to model the number of arrivals per minute at the campus dining hall during lunch.We observe the actual arrivals in 200 one-minute periods in 1 week.The sample mean is 3.8 and the results are shown below.  The probabilities based on a Poisson distribution with a mean of 3.8 are shown below.
  Perform a formal test to determine if the observed counts are compatible with the Poisson distribution with a mean of 3.8 and a significance level of .05.
A)The P-value is very small;therefore the observed counts are compatible with the Poisson distribution.
B)The P-value is large;therefore the observed counts are compatible with the Poisson distribution.
C)The P-value is very small;therefore the observed counts are not compatible with the Poisson distribution.
D)The P-value is large;therefore the observed counts are not compatible with the Poisson distribution.
The probabilities based on a Poisson distribution with a mean of 3.8 are shown below. Perform a formal test to determine if the observed counts are compatible with the Poisson distribution with a mean of 3.8 and a significance level of .05.A)The P-value is very small;therefore the observed counts are compatible with the Poisson distribution.
B)The P-value is large;therefore the observed counts are compatible with the Poisson distribution.
C)The P-value is very small;therefore the observed counts are not compatible with the Poisson distribution.
D)The P-value is large;therefore the observed counts are not compatible with the Poisson distribution.
Question
Which of the following could be a 2 distribution?
A)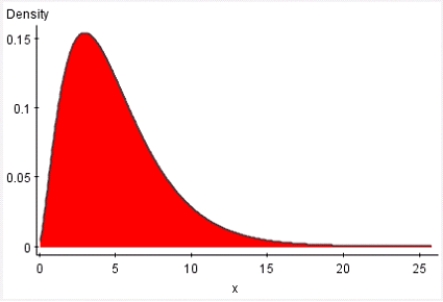
B)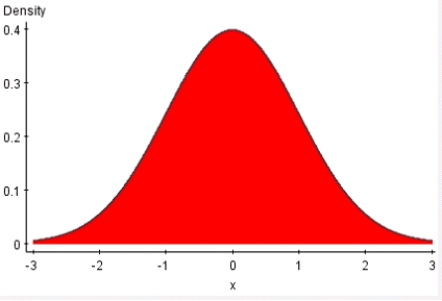
C)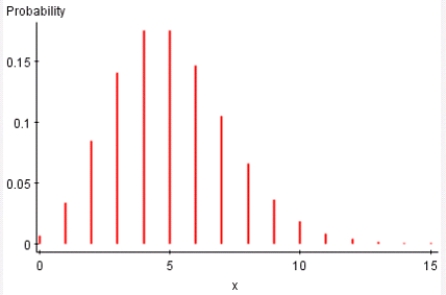
D)None of the above
A)
B)
C)
D)None of the above
Question
Because statistical software plays such an important role in modern statistical applications,many studies have encouraged the use of technology in statistics courses.The Guidelines for the Assessment and Instruction in Statistics Education (GAISE)(Aliaga et al. ,2005)project was funded by the American Statistical Association to examine needs for college level statistics courses.One of the six recommendations from GAISE is the use of technology for developing conceptual understanding and analyzing data.A survey was sent to students at 100 different universities across the United States to access the relationship between ease of learning the statistical software program SAS and a student's currently level of SAS proficiency.The results of the survey are published in Jackson et al. ,2011,in the International Mathematical Forum journal and are shown below. Table 1.Two-way table for ease of learning SAS and SAS proficiency level. 
 What is the expected cell count for students who find SAS very easy to learn and who are not proficient?
A)5.7
B)1
C)179.2
D)None of the above
What is the expected cell count for students who find SAS very easy to learn and who are not proficient?A)5.7
B)1
C)179.2
D)None of the above
Question
A study was performed to examine the personal goals of children in grades 4,5,and 6.A random sample of students was selected from each of the grades 4,5,and 6 from schools in Georgia.The students received a questionnaire regarding achieving personal goals.They were asked what they would most like to do at school: make good grades,be good at sports,or be popular.Results are presented by the gender of the child in the table below.  The data are going to be summarized by computing the conditional distributions of personal goals for boys and girls.What would be the entry for boys who like to make good grades?
A)0.22
B)0.43
C)0.58
D)0.70
The data are going to be summarized by computing the conditional distributions of personal goals for boys and girls.What would be the entry for boys who like to make good grades?A)0.22
B)0.43
C)0.58
D)0.70
Question
Because statistical software plays such an important role in modern statistical applications,many studies have encouraged the use of technology in statistics courses.The Guidelines for the Assessment and Instruction in Statistics Education (GAISE)(Aliaga et al. ,2005)project was funded by the American Statistical Association to examine needs for college level statistics courses.One of the six recommendations from GAISE is the use of technology for developing conceptual understanding and analyzing data.A survey was sent to students at 100 different universities across the United States to access the relationship between ease of learning the statistical software program SAS and a student's currently level of SAS proficiency.The results of the survey are published in Jackson et al. ,2011,in the International Mathematical Forum journal and are shown below. Table 1.Two-way table for ease of learning SAS and SAS proficiency level. 
 Perform a formal test to determine if there is a relationship between ease of learning SAS and SAS proficiency at the .05 significance level.
A)There is no relationship between ease of learning SAS and SAS proficiency.
B)There is a very weak relationship between ease of learning SAS and SAS proficiency.
C)There is a strong relationship between ease of learning SAS and SAS proficiency.
D)None of the above
Perform a formal test to determine if there is a relationship between ease of learning SAS and SAS proficiency at the .05 significance level.A)There is no relationship between ease of learning SAS and SAS proficiency.
B)There is a very weak relationship between ease of learning SAS and SAS proficiency.
C)There is a strong relationship between ease of learning SAS and SAS proficiency.
D)None of the above
Question
The Poisson distribution is a discrete distribution that expresses the probability of a fixed number of events occurring in a fixed interval.For example,suppose we want to model the number of arrivals per minute at the campus dining hall during lunch.We observe the actual arrivals in 200 one-minute periods in 1 week.The sample mean is 3.8 and the results are shown below. 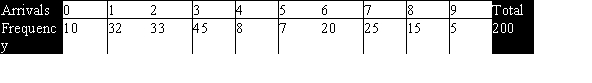 The probabilities based on a Poisson distribution with a mean of 3.8 are shown below.
  How many degrees of freedom is the goodness-of-fit test statistic based on?
A)10
B)9
C)100
D)81
The probabilities based on a Poisson distribution with a mean of 3.8 are shown below. How many degrees of freedom is the goodness-of-fit test statistic based on?A)10
B)9
C)100
D)81
Question
A study was performed to examine the personal goals of children in grades 4,5,and 6.A random sample of students was selected from each of the grades 4,5,and 6 from schools in Georgia.The students received a questionnaire regarding achieving personal goals.They were asked what they would most like to do at school: make good grades,be good at sports,or be popular.Results are presented by the gender of the child in the table below. 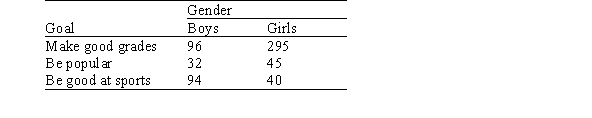 What would be the null hypothesis for a chi-square test based on these data?
A)Personal goals and gender are independent.
B)The mean personal goal is the same for boys and girls.
C)The distribution of personal goals is different for boys and girls.
D)The distribution of gender is different for the three different personal goals.
What would be the null hypothesis for a chi-square test based on these data?A)Personal goals and gender are independent.
B)The mean personal goal is the same for boys and girls.
C)The distribution of personal goals is different for boys and girls.
D)The distribution of gender is different for the three different personal goals.
Question
The Poisson distribution is a discrete distribution that expresses the probability of a fixed number of events occurring in a fixed interval.For example,suppose we want to model the number of arrivals per minute at the campus dining hall during lunch.We observe the actual arrivals in 200 one-minute periods in 1 week.The sample mean is 3.8 and the results are shown below.  The probabilities based on a Poisson distribution with a mean of 3.8 are shown below.
 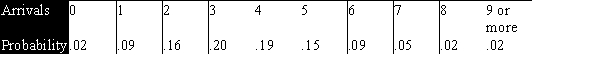 What is the expected count for 0 arrivals?
A)10
B)200
C)4
D)None of the above
The probabilities based on a Poisson distribution with a mean of 3.8 are shown below. What is the expected count for 0 arrivals?A)10
B)200
C)4
D)None of the above
Question
Because statistical software plays such an important role in modern statistical applications,many studies have encouraged the use of technology in statistics courses.The Guidelines for the Assessment and Instruction in Statistics Education (GAISE)(Aliaga et al. ,2005)project was funded by the American Statistical Association to examine needs for college level statistics courses.One of the six recommendations from GAISE is the use of technology for developing conceptual understanding and analyzing data.A survey was sent to students at 100 different universities across the United States to access the relationship between ease of learning the statistical software program SAS and a student's currently level of SAS proficiency.The results of the survey are published in Jackson et al. ,2011,in the International Mathematical Forum journal and are shown below. Table 1.Two-way table for ease of learning SAS and SAS proficiency level. 
 What are the degrees of freedom for the test statistic used to test for a relationship between ease of learning SAS and SAS proficiency?
A)4
B)6
C)9
D)None of the above
What are the degrees of freedom for the test statistic used to test for a relationship between ease of learning SAS and SAS proficiency?A)4
B)6
C)9
D)None of the above
Question
Because statistical software plays such an important role in modern statistical applications,many studies have encouraged the use of technology in statistics courses.The Guidelines for the Assessment and Instruction in Statistics Education (GAISE)(Aliaga et al. ,2005)project was funded by the American Statistical Association to examine needs for college level statistics courses.One of the six recommendations from GAISE is the use of technology for developing conceptual understanding and analyzing data.A survey was sent to students at 100 different universities across the United States to access the relationship between ease of learning the statistical software program SAS and a student's currently level of SAS proficiency.The results of the survey are published in Jackson et al. ,2011,in the International Mathematical Forum journal and are shown below. Table 1.Two-way table for ease of learning SAS and SAS proficiency level. 
 Based on examining the graphical distribution of ease of learning SAS and SAS proficiency,do you think there is a relationship between these variables?
A)No,the pattern looks completely random
B)Yes,there appears to be a relationship.SAS was easier to learn the less proficient students were at SAS.
C)Yes,there appears to be a relationship.SAS was easier to learn the more proficient students were at SAS.
D)You cannot tell from the graphs.
Based on examining the graphical distribution of ease of learning SAS and SAS proficiency,do you think there is a relationship between these variables?A)No,the pattern looks completely random
B)Yes,there appears to be a relationship.SAS was easier to learn the less proficient students were at SAS.
C)Yes,there appears to be a relationship.SAS was easier to learn the more proficient students were at SAS.
D)You cannot tell from the graphs.
Question

Unlock Deck
Sign up to unlock the cards in this deck!
Unlock Deck
Unlock Deck
1/122
Play
Full screen (f)
Deck 9: Inference for Categorical Data
1
Even though Puerto Rico is a commonwealth of the United States,there are many cultural differences between the states on the continent and the island of Puerto Rico.These differences include the way consumers handle problems with purchases.Two researchers surveyed owners of DVD players in the Northeast United States and in Puerto Rico.They asked those who had experienced problems with their DVD players whether they complained.The results are given in the table below. The SPSS output for the above table is given below.The output includes the cell counts,the expected cell counts,and the chi-square statistic.Expected counts are printed below observed counts. Chi-square = 0.855 + 3.744 + 0.276 + 1.204 = 6.079 What proportion of Puerto Ricans did not complain?
A)0.063
B)0.26
C)0.34
D)0.516
The SPSS output for the above table is given below.The output includes the cell counts,the expected cell counts,and the chi-square statistic.Expected counts are printed below observed counts. Chi-square = 0.855 + 3.744 + 0.276 + 1.204 = 6.079 What proportion of Puerto Ricans did not complain?A)0.063
B)0.26
C)0.34
D)0.516
0.34
2
Are avid readers more likely to wear glasses than those who read less frequently? Three hundred men in Ohio were selected at random and characterized as to whether they wore glasses and whether the amount of reading they did was above average,average,or below average.The results are presented in the following table. This is an r × c table.What is the value of the number r?
A)2
B)3
C)4
D)6
This is an r × c table.What is the value of the number r?A)2
B)3
C)4
D)6
3
3
When a police officer responds to a call for help in a case of spousal abuse,what should the officer do? A randomized controlled experiment in Charlotte,North Carolina,studied three police responses to spousal abuse: advise and possibly separate the couple,issue a citation to the offender,and arrest the offender.The effectiveness of the three responses was determined by re-arrest rates.The table below shows these rates. What is the proportion of all cases in which the assigned treatment was "Advise/separate"?
A)0.29
B)0.33
C)0.84
D)0.88
What is the proportion of all cases in which the assigned treatment was "Advise/separate"?A)0.29
B)0.33
C)0.84
D)0.88
0.33
4
Even though Puerto Rico is a commonwealth of the United States,there are many cultural differences between the states on the continent and the island of Puerto Rico.These differences include the way consumers handle problems with purchases.Two researchers surveyed owners of DVD players in the Northeast United States and in Puerto Rico.They asked those who had experienced problems with their DVD players whether they complained.The results are given in the table below. The SPSS output for the above table is given below.The output includes the cell counts,the expected cell counts,and the chi-square statistic.Expected counts are printed below observed counts. Chi-square = 0.855 + 3.744 + 0.276 + 1.204 = 6.079 What are the appropriate degrees of freedom for the chi-square statistic under the appropriate null hypotheis?
A)1
B)2
C)3
D)4
The SPSS output for the above table is given below.The output includes the cell counts,the expected cell counts,and the chi-square statistic.Expected counts are printed below observed counts. Chi-square = 0.855 + 3.744 + 0.276 + 1.204 = 6.079 What are the appropriate degrees of freedom for the chi-square statistic under the appropriate null hypotheis?A)1
B)2
C)3
D)4
Unlock Deck
Unlock for access to all 122 flashcards in this deck.
Unlock Deck
k this deck
5
When a police officer responds to a call for help in a case of spousal abuse,what should the officer do? A randomized controlled experiment in Charlotte,North Carolina,studied three police responses to spousal abuse: advise and possibly separate the couple,issue a citation to the offender,and arrest the offender.The effectiveness of the three responses was determined by re-arrest rates.The table below shows these rates. What proportion of times were there no subsequent arrests out of all cases in which the assigned treatment was "Advise/separate"?
A)0.29
B)0.33
C)0.84
D)0.88
What proportion of times were there no subsequent arrests out of all cases in which the assigned treatment was "Advise/separate"?A)0.29
B)0.33
C)0.84
D)0.88
Unlock Deck
Unlock for access to all 122 flashcards in this deck.
Unlock Deck
k this deck
6
The 94 students in a statistics class are categorized by gender and by the year in school.The numbers obtained are displayed below. Suppose we wish to test the null hypothesis that there is no association between the year in school and gender.Under the null hypothesis,what is the expected number of male sophomores?
A)2
B)6
C)6.27
D)9.5
Suppose we wish to test the null hypothesis that there is no association between the year in school and gender.Under the null hypothesis,what is the expected number of male sophomores?A)2
B)6
C)6.27
D)9.5
Unlock Deck
Unlock for access to all 122 flashcards in this deck.
Unlock Deck
k this deck
7
The following table provides the results of a study in a major hospital concerning patients and their supplemental health coverage.A random sample of 95 surgical patients showed that 36 had supplemental health coverage;in a second random sample of 125 medical patients,56 had coverage. If we wanted to test for the equality of the proportion of patients of the two types that have supplemental health coverage (i.e. ,H0: against Ha: ),which of the following statements about the appropriate analysis (at the = 0.05 level)would be FALSE?
A)We could use a test with 1 degree of freedom.
B)We would reject the null hypothesis here if the observed | Z | > 1.96 or if > 3.84.
C)Both the z test and the test can be extended to test the equality of more than two proportions.
D)We could use a two-tailed z test for the equality of two proportions.
E)The test and the z test are equivalent because the square of the z statistic is equal to
with 1 degree of freedom.
If we wanted to test for the equality of the proportion of patients of the two types that have supplemental health coverage (i.e. ,H0: against Ha: ),which of the following statements about the appropriate analysis (at the = 0.05 level)would be FALSE?A)We could use a
test with 1 degree of freedom.B)We would reject the null hypothesis here if the observed | Z | > 1.96 or if
> 3.84.C)Both the z test and the
test can be extended to test the equality of more than two proportions.D)We could use a two-tailed z test for the equality of two proportions.
E)The
test and the z test are equivalent because the square of the z statistic is equal to with 1 degree of freedom. Unlock Deck
Unlock for access to all 122 flashcards in this deck.
Unlock Deck
k this deck
8
Even though Puerto Rico is a commonwealth of the United States,there are many cultural differences between the states on the continent and the island of Puerto Rico.These differences include the way consumers handle problems with purchases.Two researchers surveyed owners of DVD players in the Northeast United States and in Puerto Rico.They asked those who had experienced problems with their DVD players whether they complained.The results are given in the table below. The SPSS output for the above table is given below.The output includes the cell counts,the expected cell counts,and the chi-square statistic.Expected counts are printed below observed counts. Chi-square = 0.855 + 3.744 + 0.276 + 1.204 = 6.079 What do we know about the P-value for testing the null hypothesis that the probability of complaining is the same for the United States and Puerto Rico?
A)P-value < 0.010
B)0.010 < P-value < 0.025
C)0.025 < P-value < 0.05
D)This cannot be determined because these are not the hypotheses being tested by the chi-square test.
The SPSS output for the above table is given below.The output includes the cell counts,the expected cell counts,and the chi-square statistic.Expected counts are printed below observed counts. Chi-square = 0.855 + 3.744 + 0.276 + 1.204 = 6.079 What do we know about the P-value for testing the null hypothesis that the probability of complaining is the same for the United States and Puerto Rico?A)P-value < 0.010
B)0.010 < P-value < 0.025
C)0.025 < P-value < 0.05
D)This cannot be determined because these are not the hypotheses being tested by the chi-square test.
Unlock Deck
Unlock for access to all 122 flashcards in this deck.
Unlock Deck
k this deck
9
Television networks frequently run public opinion polls on issues of concern.One network conducted a scientific poll asking a question concerning the approval rating of the way President Obama was handling the Iraq War.At about the same time a second network ran an online poll using a very similar question.The results of the two polls are summarized in the following table. We would like to test to see if the two polls are consistent with respect to the proportion who approve of President Obama's handling of the war,i.e. ,H0: If the test is used to test the null hypothesis,the expected cell count in the online poll for those who approve and that cell's contribution to the value of the test statistic are,respectively,
A)390.1 and 7.70.
B)333.9 and 6.78.
C)390.1 and 6.69.
D)333.9 and 7.81.
E)362.0 and 1.46.
We would like to test to see if the two polls are consistent with respect to the proportion who approve of President Obama's handling of the war,i.e. ,H0: If the test is used to test the null hypothesis,the expected cell count in the online poll for those who approve and that cell's contribution to the value of the test statistic are,respectively,A)390.1 and 7.70.
B)333.9 and 6.78.
C)390.1 and 6.69.
D)333.9 and 7.81.
E)362.0 and 1.46.
Unlock Deck
Unlock for access to all 122 flashcards in this deck.
Unlock Deck
k this deck
10
Which of the following statements about r × c tables is/are FALSE?
A)The null hypothesis is tested using the chi-square statistic with (r - 1)(c - 1)degrees of freedom.
B)The statistic used to test the null hypothesis is denoted by .
C)The P-value for the test is P( ),where
is a random variable having the
(df)distribution with df = (r - 1)(c - 1).
D)Under the null hypothesis the statistic has approximately a chi-square distribution with (r - 1)(c - 1)degrees of freedom.
E)The chi-square approximation is adequate when the average expected cell count is 5 or greater and all individual expected counts are 1 or greater,except in the case of 2 × 2 tables.
A)The null hypothesis is tested using the chi-square statistic with (r - 1)(c - 1)degrees of freedom.
B)The statistic used to test the null hypothesis is denoted by
.C)The P-value for the test is P(
),where is a random variable having the (df)distribution with df = (r - 1)(c - 1).D)Under the null hypothesis the
statistic has approximately a chi-square distribution with (r - 1)(c - 1)degrees of freedom.E)The chi-square approximation is adequate when the average expected cell count is 5 or greater and all individual expected counts are 1 or greater,except in the case of 2 × 2 tables.
Unlock Deck
Unlock for access to all 122 flashcards in this deck.
Unlock Deck
k this deck
11
A review of voter registration records in a small town yielded the following table of the number of males and females registered as Democrat,Republican,or some other affiliation. Suppose we wish to test the null hypothesis that there is no association between party affiliation and gender.Under the null hypothesis,what is the expected number of male Democrats?
A)300
B)333.3
C)450
D)500
Suppose we wish to test the null hypothesis that there is no association between party affiliation and gender.Under the null hypothesis,what is the expected number of male Democrats?A)300
B)333.3
C)450
D)500
Unlock Deck
Unlock for access to all 122 flashcards in this deck.
Unlock Deck
k this deck
12
Even though Puerto Rico is a commonwealth of the United States,there are many cultural differences between the states on the continent and the island of Puerto Rico.These differences include the way consumers handle problems with purchases.Two researchers surveyed owners of DVD players in the Northeast United States and in Puerto Rico.They asked those who had experienced problems with their DVD players whether they complained.The results are given in the table below. The SPSS output for the above table is given below.The output includes the cell counts,the expected cell counts,and the chi-square statistic.Expected counts are printed below observed counts. Chi-square = 0.855 + 3.744 + 0.276 + 1.204 = 6.079 Which cell contributes most to the chi-square statistic?
A)Americans in the United States who did not complain
B)Americans in the United States who complained
C)Puerto Ricans who did not complain
D)Puerto Ricans who did complain
The SPSS output for the above table is given below.The output includes the cell counts,the expected cell counts,and the chi-square statistic.Expected counts are printed below observed counts. Chi-square = 0.855 + 3.744 + 0.276 + 1.204 = 6.079 Which cell contributes most to the chi-square statistic?A)Americans in the United States who did not complain
B)Americans in the United States who complained
C)Puerto Ricans who did not complain
D)Puerto Ricans who did complain
Unlock Deck
Unlock for access to all 122 flashcards in this deck.
Unlock Deck
k this deck
13
Which of the following statements about the analysis of two-way tables is/are TRUE?
A)Under the null hypothesis,the expected cell count is = .
B)In a table with r rows and c columns,the number of degrees of freedom is (r - 1)(c - 1).
C)A possible null hypothesis is that there is no association between the row and column variables.
D)All of the above are true.
E)Only A and B are true.
A)Under the null hypothesis,the expected cell count is =
.B)In a table with r rows and c columns,the number of degrees of freedom is (r - 1)(c - 1).
C)A possible null hypothesis is that there is no association between the row and column variables.
D)All of the above are true.
E)Only A and B are true.
Unlock Deck
Unlock for access to all 122 flashcards in this deck.
Unlock Deck
k this deck
14
Are avid readers more likely to wear glasses than those who read less frequently? Three hundred men in Ohio were selected at random and characterized as to whether they wore glasses and whether the amount of reading they did was above average,average,or below average.The results are presented in the following table. Suppose we wish to test the null hypothesis that there is no association between the amount of reading and wearing glasses.Under the null hypothesis,what is the numerical value of the chi-square statistic?
A)2
B)8.65
C)21
D)30.7
Suppose we wish to test the null hypothesis that there is no association between the amount of reading and wearing glasses.Under the null hypothesis,what is the numerical value of the chi-square statistic?A)2
B)8.65
C)21
D)30.7
Unlock Deck
Unlock for access to all 122 flashcards in this deck.
Unlock Deck
k this deck
15
Television networks frequently run public opinion polls on issues of concern.Recently one network conducted a scientific poll asking a question concerning the approval rating of the way President Obama was handling the Iraq War.At about the same time a second network ran an online poll using a very similar question.The results of the two polls are summarized in the following table. We would like to test to see if the two polls are consistent with respect to the proportion who approve of President Obama's handling of the war (i.e. ,H0: ). A statistic was calculated under the null hypothesis,which has the value 22.28.If the respondents in both polls can be considered to come from random samples,what is this statistic?
A)It is approximately a t with 1 degree of freedom.
B)It is a statistic with approximately a chi-square distribution with 3 degrees of freedom.
C)It is a statistic with an approximate chi-square distribution with 1 degree of freedom.
D)It is a z statistic.
E)It is none of the above.
We would like to test to see if the two polls are consistent with respect to the proportion who approve of President Obama's handling of the war (i.e. ,H0: ). A statistic was calculated under the null hypothesis,which has the value 22.28.If the respondents in both polls can be considered to come from random samples,what is this statistic?A)It is approximately a t with 1 degree of freedom.
B)It is a statistic with approximately a chi-square distribution with 3 degrees of freedom.
C)It is a statistic with an approximate chi-square distribution with 1 degree of freedom.
D)It is a z statistic.
E)It is none of the above.
Unlock Deck
Unlock for access to all 122 flashcards in this deck.
Unlock Deck
k this deck
16
When a police officer responds to a call for help in a case of spousal abuse,what should the officer do? A randomized controlled experiment in Charlotte,North Carolina,studied three police responses to spousal abuse: advise and possibly separate the couple,issue a citation to the offender,and arrest the offender.The effectiveness of the three responses was determined by re-arrest rates.The table below shows these rates. Suppose we wish to test the null hypothesis that the proportions of subsequent arrests are the same regardless of the treatment assigned.Under the null hypothesis,what is the expected number of times no subsequent arrest would occur for the treatment "Advise/separate"?
A)177
B)181
C)187
D)543
Suppose we wish to test the null hypothesis that the proportions of subsequent arrests are the same regardless of the treatment assigned.Under the null hypothesis,what is the expected number of times no subsequent arrest would occur for the treatment "Advise/separate"?A)177
B)181
C)187
D)543
Unlock Deck
Unlock for access to all 122 flashcards in this deck.
Unlock Deck
k this deck
17
When a police officer responds to a call for help in a case of spousal abuse,what should the officer do? A randomized controlled experiment in Charlotte,North Carolina,studied three police responses to spousal abuse: advise and possibly separate the couple,issue a citation to the offender,and arrest the offender.The effectiveness of the three responses was determined by re-arrest rates.The table below shows these rates. Suppose we wish to test the null hypothesis that the proportions of subsequent arrests are the same regardless of the treatment assigned.Which of the following statements is true?
A)We cannot test this hypothesis because the police officers did not record the expected counts.
B)The test of the null hypothesis will have a very small P-value (below 0.0001)because the counts in each row are not identical.
C)We cannot test this hypothesis because the expected cell counts are less than five in too many of the cells.
D)The test of the null hypothesis will have a very small P-value (below 0.0001)because there were so few cases where there was more than one re-arrest.
Suppose we wish to test the null hypothesis that the proportions of subsequent arrests are the same regardless of the treatment assigned.Which of the following statements is true?A)We cannot test this hypothesis because the police officers did not record the expected counts.
B)The test of the null hypothesis will have a very small P-value (below 0.0001)because the counts in each row are not identical.
C)We cannot test this hypothesis because the expected cell counts are less than five in too many of the cells.
D)The test of the null hypothesis will have a very small P-value (below 0.0001)because there were so few cases where there was more than one re-arrest.
Unlock Deck
Unlock for access to all 122 flashcards in this deck.
Unlock Deck
k this deck
18
Even though Puerto Rico is a commonwealth of the United States,there are many cultural differences between the states on the continent and the island of Puerto Rico.These differences include the way consumers handle problems with purchases.Two researchers surveyed owners of DVD players in the Northeast United States and in Puerto Rico.They asked those who had experienced problems with their DVD players whether they complained.The results are given in the table below. The SPSS output for the above table is given below.The output includes the cell counts,the expected cell counts,and the chi-square statistic.Expected counts are printed below observed counts. Chi-square = 0.855 + 3.744 + 0.276 + 1.204 = 6.079 What proportion of Americans did not complain?
A)0.18
B)0.194
C)0.22
D)0.74
The SPSS output for the above table is given below.The output includes the cell counts,the expected cell counts,and the chi-square statistic.Expected counts are printed below observed counts. Chi-square = 0.855 + 3.744 + 0.276 + 1.204 = 6.079 What proportion of Americans did not complain?A)0.18
B)0.194
C)0.22
D)0.74
Unlock Deck
Unlock for access to all 122 flashcards in this deck.
Unlock Deck
k this deck
19
Are avid readers more likely to wear glasses than those who read less frequently? Three hundred men in Ohio were selected at random and characterized as to whether they wore glasses and whether the amount of reading they did was above average,average,or below average.The results are presented in the following table. Suppose we wish to test the null hypothesis that there is no association between the amount of reading and wearing glasses.Under the null hypothesis,what is the expected number of above average readers who wear glasses?
A)27.2
B)30.7
C)47
D)81.1
Suppose we wish to test the null hypothesis that there is no association between the amount of reading and wearing glasses.Under the null hypothesis,what is the expected number of above average readers who wear glasses?A)27.2
B)30.7
C)47
D)81.1
Unlock Deck
Unlock for access to all 122 flashcards in this deck.
Unlock Deck
k this deck
20
Prior to graduation,a high school class was surveyed about their plans after high school.The table below displays the results by gender. Suppose we wish to test the null hypothesis that there is no association between plans after high school and gender.Under the null hypothesis,what is the expected number of female students who are planning to work?
A)3
B)7.68
C)8.5
D)39.46
Suppose we wish to test the null hypothesis that there is no association between plans after high school and gender.Under the null hypothesis,what is the expected number of female students who are planning to work?A)3
B)7.68
C)8.5
D)39.46
Unlock Deck
Unlock for access to all 122 flashcards in this deck.
Unlock Deck
k this deck
21
The r and c notations used in two-way tables represent what?
Unlock Deck
Unlock for access to all 122 flashcards in this deck.
Unlock Deck
k this deck
22
Give a definition for meta-analysis.
Unlock Deck
Unlock for access to all 122 flashcards in this deck.
Unlock Deck
k this deck
23
The 2 distributions take on ___________ values.
A)positive
B)negative
C)positive and negative
A)positive
B)negative
C)positive and negative
Unlock Deck
Unlock for access to all 122 flashcards in this deck.
Unlock Deck
k this deck
24
The chi-square distribution is described by a single parameter called the _______.
A)degree of freedom
B)mean
C)variance
D)None of the above
A)degree of freedom
B)mean
C)variance
D)None of the above
Unlock Deck
Unlock for access to all 122 flashcards in this deck.
Unlock Deck
k this deck
25
The chi-square distribution is ___________.
A)skewed to the right
B)skewed to the left
C)symmetric
A)skewed to the right
B)skewed to the left
C)symmetric
Unlock Deck
Unlock for access to all 122 flashcards in this deck.
Unlock Deck
k this deck
26
Large values obtained for the 2 two-way tables provide evidence _____ the null hypothesis.
A)against
B)in favor of
A)against
B)in favor of
Unlock Deck
Unlock for access to all 122 flashcards in this deck.
Unlock Deck
k this deck
27
The chi-square test for two-way tables can be used to test a _______.
A)one-sided alternative hypothesis
B)two-sided alternative hypothesis
C)one-sided or two-sided hypothesis
A)one-sided alternative hypothesis
B)two-sided alternative hypothesis
C)one-sided or two-sided hypothesis
Unlock Deck
Unlock for access to all 122 flashcards in this deck.
Unlock Deck
k this deck
28
The alternative hypothesis Ha in a two-way table represents which of the following?
A)There is no association between the row variable and the column variable.
B)There is an association between the row variable and the column variable.
C)None of the above
A)There is no association between the row variable and the column variable.
B)There is an association between the row variable and the column variable.
C)None of the above
Unlock Deck
Unlock for access to all 122 flashcards in this deck.
Unlock Deck
k this deck
29
The chi-square distribution is a _______ distribution.
A)continuous
B)discrete
A)continuous
B)discrete
Unlock Deck
Unlock for access to all 122 flashcards in this deck.
Unlock Deck
k this deck
30
Could mud wrestling be the cause of a rash contracted by University of Washington students in the spring of 1992? Two physicians at the University of Washington student health center wondered this when one male and six female students complained of rashes after participating in a mud-wrestling event.Questionnaires were sent to all students in the residence halls who participated in the event.The questionnaire asked about the appearance of a rash and about attendance at the mud-wrestling event.The results,by gender,are summarized in the following table. The SPSS output for the above table is given below.The output includes the cell counts,the expected cell counts,the chi-square statistic,and its degrees of freedom.Expected counts are printed below observed counts. Chi-square = 2.289 + 1.098 + 1.098 + 0.527 = 5.002 df = 1,P-value = 0.0253
Which cell contributes most to the chi-square statistic?
A)Men who developed a rash
B)Men who did not develop a rash
C)Women who developed a rash
D)Women who did not develop a rash
The SPSS output for the above table is given below.The output includes the cell counts,the expected cell counts,the chi-square statistic,and its degrees of freedom.Expected counts are printed below observed counts. Chi-square = 2.289 + 1.098 + 1.098 + 0.527 = 5.002 df = 1,P-value = 0.0253Which cell contributes most to the chi-square statistic?
A)Men who developed a rash
B)Men who did not develop a rash
C)Women who developed a rash
D)Women who did not develop a rash
Unlock Deck
Unlock for access to all 122 flashcards in this deck.
Unlock Deck
k this deck
31
How is the expected cell count obtained for two-way tables?
Unlock Deck
Unlock for access to all 122 flashcards in this deck.
Unlock Deck
k this deck
32
To test the null hypothesis in r × c tables,we compare the observed counts with _____ counts.
Unlock Deck
Unlock for access to all 122 flashcards in this deck.
Unlock Deck
k this deck
33
It is thought that people with psychopathic traits are bigger risk takers than people with non-psychopathic traits.A study was conducted by asking participants to fill out surveys to detect whether or not they are psychopathic.Then each subject played a game their measured their risk-taking propensity as either a low-risk taker or a high-risk taker.Could this study be analyzed using a two-way table?
A)Yes
B)No
A)Yes
B)No
Unlock Deck
Unlock for access to all 122 flashcards in this deck.
Unlock Deck
k this deck
34
The null hypothesis H0 in a two-way table represents which of the following?
A)There is no association between the row variable and the column variable.
B)There is an association between the row variable and the column variable.
C)None of the above
A)There is no association between the row variable and the column variable.
B)There is an association between the row variable and the column variable.
C)None of the above
Unlock Deck
Unlock for access to all 122 flashcards in this deck.
Unlock Deck
k this deck
35
The chi-square test always uses the ____ tail of the 2 distribution.
A)upper
B)lower
A)upper
B)lower
Unlock Deck
Unlock for access to all 122 flashcards in this deck.
Unlock Deck
k this deck
36
The degree of freedom associated with a chi-square test for two-way tables with r rows and c columns is
A)r - 1.
B)c - 1.
C)(r - 1)(c - 1).
A)r - 1.
B)c - 1.
C)(r - 1)(c - 1).
Unlock Deck
Unlock for access to all 122 flashcards in this deck.
Unlock Deck
k this deck
37
You will obtain a large value for 2 if expected cell counts and observed cell counts in any cell of a two-way table are very different.
Unlock Deck
Unlock for access to all 122 flashcards in this deck.
Unlock Deck
k this deck
38
Two-way tables are for use on data derived from __________.
A)quantitative variables
B)categorical variables
A)quantitative variables
B)categorical variables
Unlock Deck
Unlock for access to all 122 flashcards in this deck.
Unlock Deck
k this deck
39
Could mud wrestling be the cause of a rash contracted by University of Washington students in the spring of 1992? Two physicians at the University of Washington student health center wondered this when one male and six female students complained of rashes after participating in a mud-wrestling event.Questionnaires were sent to all students in the residence halls who participated in the event.The questionnaire asked about the appearance of a rash and about attendance at the mud-wrestling event.The results,by gender,are summarized in the following table. The SPSS output for the above table is given below.The output includes the cell counts,the expected cell counts,the chi-square statistic,and its degrees of freedom.Expected counts are printed below observed counts. Chi-square = 2.289 + 1.098 + 1.098 + 0.527 = 5.002 df = 1,P-value = 0.0253
What conclusion can we draw from the above tables at the 5% significance level?
A)There appears to be evidence of an association between the gender of an individual attending the event and development of a rash.
B)Mud wrestling causes a rash,especially for women.
C)There is absolutely no evidence of any relationship between the gender of an individual attending the event and the subsequent development of a rash.
D)Development of a rash is a real possibility if you attend mud-wrestling events,especially if you attend them on a regular basis.
The SPSS output for the above table is given below.The output includes the cell counts,the expected cell counts,the chi-square statistic,and its degrees of freedom.Expected counts are printed below observed counts. Chi-square = 2.289 + 1.098 + 1.098 + 0.527 = 5.002 df = 1,P-value = 0.0253What conclusion can we draw from the above tables at the 5% significance level?
A)There appears to be evidence of an association between the gender of an individual attending the event and development of a rash.
B)Mud wrestling causes a rash,especially for women.
C)There is absolutely no evidence of any relationship between the gender of an individual attending the event and the subsequent development of a rash.
D)Development of a rash is a real possibility if you attend mud-wrestling events,especially if you attend them on a regular basis.
Unlock Deck
Unlock for access to all 122 flashcards in this deck.
Unlock Deck
k this deck
40
How are the 2 statistic with 1 degree of freedom and the z statistic related?
Unlock Deck
Unlock for access to all 122 flashcards in this deck.
Unlock Deck
k this deck
41
The chi-square test can compare more than two populations.
Unlock Deck
Unlock for access to all 122 flashcards in this deck.
Unlock Deck
k this deck
42
The sum of the column percents in a two-way table should be very close to _____.
A)1
B)100
C)0
A)1
B)100
C)0
Unlock Deck
Unlock for access to all 122 flashcards in this deck.
Unlock Deck
k this deck
43
Because statistical software plays such an important role in modern statistical applications,many studies have encouraged the use of technology in statistics courses.The Guidelines for the Assessment and Instruction in Statistics Education (GAISE)(Aliaga et al. ,2005)project was funded by the American Statistical Association to examine needs for college level statistics courses.One of the six recommendations from GAISE is the use of technology for developing conceptual understanding and analyzing data.A survey was sent to students at 100 different universities across the United States to access the relationship between ease of learning the statistical software program SAS and a student's currently level of SAS proficiency.The results of the survey are published in Jackson et al. ,2011,in the International Mathematical Forum journal and are shown below. Table 1.Two-way table for ease of learning SAS and SAS proficiency level. What is the column proportion,B,for students who find SAS somewhat easy to learn and who are not proficient in SAS?
A)8/52
B)8/20
C)20/112
D)None of the above
What is the column proportion,B,for students who find SAS somewhat easy to learn and who are not proficient in SAS?A)8/52
B)8/20
C)20/112
D)None of the above
Unlock Deck
Unlock for access to all 122 flashcards in this deck.
Unlock Deck
k this deck
44
Because statistical software plays such an important role in modern statistical applications,many studies have encouraged the use of technology in statistics courses.The Guidelines for the Assessment and Instruction in Statistics Education (GAISE)(Aliaga et al. ,2005)project was funded by the American Statistical Association to examine needs for college level statistics courses.One of the six recommendations from GAISE is the use of technology for developing conceptual understanding and analyzing data.A survey was sent to students at 100 different universities across the United States to access the relationship between ease of learning the statistical software program SAS and a student's currently level of SAS proficiency.The results of the survey are published in Jackson et al. ,2011,in the International Mathematical Forum journal and are shown below. Table 1.Two-way table for ease of learning SAS and SAS proficiency level. Which graph displays the correct distribution for comparing "very easy" ease of learning SAS and "very proficient" proficiency?
A)
B)
C)
D)None of the above
Which graph displays the correct distribution for comparing "very easy" ease of learning SAS and "very proficient" proficiency?A)
B)
C)
D)None of the above
Unlock Deck
Unlock for access to all 122 flashcards in this deck.
Unlock Deck
k this deck
45
Because statistical software plays such an important role in modern statistical applications,many studies have encouraged the use of technology in statistics courses.The Guidelines for the Assessment and Instruction in Statistics Education (GAISE)(Aliaga et al. ,2005)project was funded by the American Statistical Association to examine needs for college level statistics courses.One of the six recommendations from GAISE is the use of technology for developing conceptual understanding and analyzing data.A survey was sent to students at 100 different universities across the United States to access the relationship between ease of learning the statistical software program SAS and a student's currently level of SAS proficiency.The results of the survey are published in Jackson et al. ,2011,in the International Mathematical Forum journal and are shown below. Table 1.Two-way table for ease of learning SAS and SAS proficiency level. How many students were involved in the study?
A)65
B)27
C)112
D)None of the above
How many students were involved in the study?A)65
B)27
C)112
D)None of the above
Unlock Deck
Unlock for access to all 122 flashcards in this deck.
Unlock Deck
k this deck
46
Because statistical software plays such an important role in modern statistical applications,many studies have encouraged the use of technology in statistics courses.The Guidelines for the Assessment and Instruction in Statistics Education (GAISE)(Aliaga et al. ,2005)project was funded by the American Statistical Association to examine needs for college level statistics courses.One of the six recommendations from GAISE is the use of technology for developing conceptual understanding and analyzing data.A survey was sent to students at 100 different universities across the United States to access the relationship between ease of learning the statistical software program SAS and a student's currently level of SAS proficiency.The results of the survey are published in Jackson et al. ,2011,in the International Mathematical Forum journal and are shown below. Table 1.Two-way table for ease of learning SAS and SAS proficiency level. What is the column proportion,A,for students who find SAS difficult to learn and who are not proficient in SAS?
A)11/20
B)11/28
C)11/112
D)None of the above
What is the column proportion,A,for students who find SAS difficult to learn and who are not proficient in SAS?A)11/20
B)11/28
C)11/112
D)None of the above
Unlock Deck
Unlock for access to all 122 flashcards in this deck.
Unlock Deck
k this deck
47
Because statistical software plays such an important role in modern statistical applications,many studies have encouraged the use of technology in statistics courses.The Guidelines for the Assessment and Instruction in Statistics Education (GAISE)(Aliaga et al. ,2005)project was funded by the American Statistical Association to examine needs for college level statistics courses.One of the six recommendations from GAISE is the use of technology for developing conceptual understanding and analyzing data.A survey was sent to students at 100 different universities across the United States to access the relationship between ease of learning the statistical software program SAS and a student's currently level of SAS proficiency.The results of the survey are published in Jackson et al. ,2011,in the International Mathematical Forum journal and are shown below. Table 1.Two-way table for ease of learning SAS and SAS proficiency level. What is the column proportion,G,for students who find SAS difficult to learn and who are very proficient in SAS?
A)27/112
B)2/112
C)2/28
D)None of the above
What is the column proportion,G,for students who find SAS difficult to learn and who are very proficient in SAS?A)27/112
B)2/112
C)2/28
D)None of the above
Unlock Deck
Unlock for access to all 122 flashcards in this deck.
Unlock Deck
k this deck
48
Because statistical software plays such an important role in modern statistical applications,many studies have encouraged the use of technology in statistics courses.The Guidelines for the Assessment and Instruction in Statistics Education (GAISE)(Aliaga et al. ,2005)project was funded by the American Statistical Association to examine needs for college level statistics courses.One of the six recommendations from GAISE is the use of technology for developing conceptual understanding and analyzing data.A survey was sent to students at 100 different universities across the United States to access the relationship between ease of learning the statistical software program SAS and a student's currently level of SAS proficiency.The results of the survey are published in Jackson et al. ,2011,in the International Mathematical Forum journal and are shown below. Table 1.Two-way table for ease of learning SAS and SAS proficiency level. What is the value of K?
A)52
B)52/112
C)100
D)None of the above
What is the value of K?A)52
B)52/112
C)100
D)None of the above
Unlock Deck
Unlock for access to all 122 flashcards in this deck.
Unlock Deck
k this deck
49
Because statistical software plays such an important role in modern statistical applications,many studies have encouraged the use of technology in statistics courses.The Guidelines for the Assessment and Instruction in Statistics Education (GAISE)(Aliaga et al. ,2005)project was funded by the American Statistical Association to examine needs for college level statistics courses.One of the six recommendations from GAISE is the use of technology for developing conceptual understanding and analyzing data.A survey was sent to students at 100 different universities across the United States to access the relationship between ease of learning the statistical software program SAS and a student's currently level of SAS proficiency.The results of the survey are published in Jackson et al. ,2011,in the International Mathematical Forum journal and are shown below. Table 1.Two-way table for ease of learning SAS and SAS proficiency level. Which graph displays the correct distribution for comparing "very easy" ease of learning SAS and "not proficient" proficiency?
A)
B)
C)
D)None of the above
Which graph displays the correct distribution for comparing "very easy" ease of learning SAS and "not proficient" proficiency?A)
B)
C)
D)None of the above
Unlock Deck
Unlock for access to all 122 flashcards in this deck.
Unlock Deck
k this deck
50
Because statistical software plays such an important role in modern statistical applications,many studies have encouraged the use of technology in statistics courses.The Guidelines for the Assessment and Instruction in Statistics Education (GAISE)(Aliaga et al. ,2005)project was funded by the American Statistical Association to examine needs for college level statistics courses.One of the six recommendations from GAISE is the use of technology for developing conceptual understanding and analyzing data.A survey was sent to students at 100 different universities across the United States to access the relationship between ease of learning the statistical software program SAS and a student's currently level of SAS proficiency.The results of the survey are published in Jackson et al. ,2011,in the International Mathematical Forum journal and are shown below. Table 1.Two-way table for ease of learning SAS and SAS proficiency level. What is the column proportion,F,for students who find SAS very easy to learn and who are somewhat proficient in SAS?
A)17/65
B)17/32
C)17/112
D)None of the above
What is the column proportion,F,for students who find SAS very easy to learn and who are somewhat proficient in SAS?A)17/65
B)17/32
C)17/112
D)None of the above
Unlock Deck
Unlock for access to all 122 flashcards in this deck.
Unlock Deck
k this deck
51
Because statistical software plays such an important role in modern statistical applications,many studies have encouraged the use of technology in statistics courses.The Guidelines for the Assessment and Instruction in Statistics Education (GAISE)(Aliaga et al. ,2005)project was funded by the American Statistical Association to examine needs for college level statistics courses.One of the six recommendations from GAISE is the use of technology for developing conceptual understanding and analyzing data.A survey was sent to students at 100 different universities across the United States to access the relationship between ease of learning the statistical software program SAS and a student's currently level of SAS proficiency.The results of the survey are published in Jackson et al. ,2011,in the International Mathematical Forum journal and are shown below. Table 1.Two-way table for ease of learning SAS and SAS proficiency level. The letters J,K,and L represent the ______ distribution for ease of learning SAS.
A)conditional
B)marginal
C)joint
D)2
The letters J,K,and L represent the ______ distribution for ease of learning SAS.A)conditional
B)marginal
C)joint
D)2
Unlock Deck
Unlock for access to all 122 flashcards in this deck.
Unlock Deck
k this deck
52
Because statistical software plays such an important role in modern statistical applications,many studies have encouraged the use of technology in statistics courses.The Guidelines for the Assessment and Instruction in Statistics Education (GAISE)(Aliaga et al. ,2005)project was funded by the American Statistical Association to examine needs for college level statistics courses.One of the six recommendations from GAISE is the use of technology for developing conceptual understanding and analyzing data.A survey was sent to students at 100 different universities across the United States to access the relationship between ease of learning the statistical software program SAS and a student's currently level of SAS proficiency.The results of the survey are published in Jackson et al. ,2011,in the International Mathematical Forum journal and are shown below. Table 1.Two-way table for ease of learning SAS and SAS proficiency level. What is the value of J?
A)28
B)28/112
C)100
D)None of the above
What is the value of J?A)28
B)28/112
C)100
D)None of the above
Unlock Deck
Unlock for access to all 122 flashcards in this deck.
Unlock Deck
k this deck
53
Because statistical software plays such an important role in modern statistical applications,many studies have encouraged the use of technology in statistics courses.The Guidelines for the Assessment and Instruction in Statistics Education (GAISE)(Aliaga et al. ,2005)project was funded by the American Statistical Association to examine needs for college level statistics courses.One of the six recommendations from GAISE is the use of technology for developing conceptual understanding and analyzing data.A survey was sent to students at 100 different universities across the United States to access the relationship between ease of learning the statistical software program SAS and a student's currently level of SAS proficiency.The results of the survey are published in Jackson et al. ,2011,in the International Mathematical Forum journal and are shown below. Table 1.Two-way table for ease of learning SAS and SAS proficiency level. What is the column proportion,C,for students who find SAS very easy to learn and who are not proficient in SAS?
A)1/20
B)1/32
C)2/112
D)None of the above
What is the column proportion,C,for students who find SAS very easy to learn and who are not proficient in SAS?A)1/20
B)1/32
C)2/112
D)None of the above
Unlock Deck
Unlock for access to all 122 flashcards in this deck.
Unlock Deck
k this deck
54
Because statistical software plays such an important role in modern statistical applications,many studies have encouraged the use of technology in statistics courses.The Guidelines for the Assessment and Instruction in Statistics Education (GAISE)(Aliaga et al. ,2005)project was funded by the American Statistical Association to examine needs for college level statistics courses.One of the six recommendations from GAISE is the use of technology for developing conceptual understanding and analyzing data.A survey was sent to students at 100 different universities across the United States to access the relationship between ease of learning the statistical software program SAS and a student's currently level of SAS proficiency.The results of the survey are published in Jackson et al. ,2011,in the International Mathematical Forum journal and are shown below. Table 1.Two-way table for ease of learning SAS and SAS proficiency level. What size table is shown above?
A)3 × 3
B)4 × 4
C)4 × 3
D)None of the above
What size table is shown above?A)3 × 3
B)4 × 4
C)4 × 3
D)None of the above
Unlock Deck
Unlock for access to all 122 flashcards in this deck.
Unlock Deck
k this deck
55
Because statistical software plays such an important role in modern statistical applications,many studies have encouraged the use of technology in statistics courses.The Guidelines for the Assessment and Instruction in Statistics Education (GAISE)(Aliaga et al. ,2005)project was funded by the American Statistical Association to examine needs for college level statistics courses.One of the six recommendations from GAISE is the use of technology for developing conceptual understanding and analyzing data.A survey was sent to students at 100 different universities across the United States to access the relationship between ease of learning the statistical software program SAS and a student's currently level of SAS proficiency.The results of the survey are published in Jackson et al. ,2011,in the International Mathematical Forum journal and are shown below. Table 1.Two-way table for ease of learning SAS and SAS proficiency level. What is the column proportion,I,for students who find SAS very easy to learn and who are very proficient in SAS?
A)14/32
B)27/112
C)14/27
D)None of the above
What is the column proportion,I,for students who find SAS very easy to learn and who are very proficient in SAS?A)14/32
B)27/112
C)14/27
D)None of the above
Unlock Deck
Unlock for access to all 122 flashcards in this deck.
Unlock Deck
k this deck
56
Because statistical software plays such an important role in modern statistical applications,many studies have encouraged the use of technology in statistics courses.The Guidelines for the Assessment and Instruction in Statistics Education (GAISE)(Aliaga et al. ,2005)project was funded by the American Statistical Association to examine needs for college level statistics courses.One of the six recommendations from GAISE is the use of technology for developing conceptual understanding and analyzing data.A survey was sent to students at 100 different universities across the United States to access the relationship between ease of learning the statistical software program SAS and a student's currently level of SAS proficiency.The results of the survey are published in Jackson et al. ,2011,in the International Mathematical Forum journal and are shown below. Table 1.Two-way table for ease of learning SAS and SAS proficiency level. What is the column proportion,H,for students who find SAS somewhat easy to learn and who are very proficient in SAS?
A)11/27
B)11/52
C)11/112
D)None of the above
What is the column proportion,H,for students who find SAS somewhat easy to learn and who are very proficient in SAS?A)11/27
B)11/52
C)11/112
D)None of the above
Unlock Deck
Unlock for access to all 122 flashcards in this deck.
Unlock Deck
k this deck
57
Because statistical software plays such an important role in modern statistical applications,many studies have encouraged the use of technology in statistics courses.The Guidelines for the Assessment and Instruction in Statistics Education (GAISE)(Aliaga et al. ,2005)project was funded by the American Statistical Association to examine needs for college level statistics courses.One of the six recommendations from GAISE is the use of technology for developing conceptual understanding and analyzing data.A survey was sent to students at 100 different universities across the United States to access the relationship between ease of learning the statistical software program SAS and a student's currently level of SAS proficiency.The results of the survey are published in Jackson et al. ,2011,in the International Mathematical Forum journal and are shown below. Table 1.Two-way table for ease of learning SAS and SAS proficiency level. What is the column proportion,D,for students who find SAS difficult to learn and who are somewhat proficient in SAS?
A)15/65
B)15/28
C)15/112
D)None of the above
What is the column proportion,D,for students who find SAS difficult to learn and who are somewhat proficient in SAS?A)15/65
B)15/28
C)15/112
D)None of the above
Unlock Deck
Unlock for access to all 122 flashcards in this deck.
Unlock Deck
k this deck
58
Because statistical software plays such an important role in modern statistical applications,many studies have encouraged the use of technology in statistics courses.The Guidelines for the Assessment and Instruction in Statistics Education (GAISE)(Aliaga et al. ,2005)project was funded by the American Statistical Association to examine needs for college level statistics courses.One of the six recommendations from GAISE is the use of technology for developing conceptual understanding and analyzing data.A survey was sent to students at 100 different universities across the United States to access the relationship between ease of learning the statistical software program SAS and a student's currently level of SAS proficiency.The results of the survey are published in Jackson et al. ,2011,in the International Mathematical Forum journal and are shown below. Table 1.Two-way table for ease of learning SAS and SAS proficiency level. Which graph displays the correct distribution for comparing "very easy" ease of learning SAS and "somewhat proficient" proficiency?
A)
B)
C)
D)None of the above
Which graph displays the correct distribution for comparing "very easy" ease of learning SAS and "somewhat proficient" proficiency?A)
B)
C)
D)None of the above
Unlock Deck
Unlock for access to all 122 flashcards in this deck.
Unlock Deck
k this deck
59
Because statistical software plays such an important role in modern statistical applications,many studies have encouraged the use of technology in statistics courses.The Guidelines for the Assessment and Instruction in Statistics Education (GAISE)(Aliaga et al. ,2005)project was funded by the American Statistical Association to examine needs for college level statistics courses.One of the six recommendations from GAISE is the use of technology for developing conceptual understanding and analyzing data.A survey was sent to students at 100 different universities across the United States to access the relationship between ease of learning the statistical software program SAS and a student's currently level of SAS proficiency.The results of the survey are published in Jackson et al. ,2011,in the International Mathematical Forum journal and are shown below. Table 1.Two-way table for ease of learning SAS and SAS proficiency level. What is the value of L?
A)112
B)100/112
C)32/100
D)None of the above
What is the value of L?A)112
B)100/112
C)32/100
D)None of the above
Unlock Deck
Unlock for access to all 122 flashcards in this deck.
Unlock Deck
k this deck
60
Because statistical software plays such an important role in modern statistical applications,many studies have encouraged the use of technology in statistics courses.The Guidelines for the Assessment and Instruction in Statistics Education (GAISE)(Aliaga et al. ,2005)project was funded by the American Statistical Association to examine needs for college level statistics courses.One of the six recommendations from GAISE is the use of technology for developing conceptual understanding and analyzing data.A survey was sent to students at 100 different universities across the United States to access the relationship between ease of learning the statistical software program SAS and a student's currently level of SAS proficiency.The results of the survey are published in Jackson et al. ,2011,in the International Mathematical Forum journal and are shown below. Table 1.Two-way table for ease of learning SAS and SAS proficiency level. What is the column proportion,E,for students who find SAS somewhat easy to learn and who are somewhat proficient in SAS?
A)15/2
B)33/11
C)17/112
D)None of the above
What is the column proportion,E,for students who find SAS somewhat easy to learn and who are somewhat proficient in SAS?A)15/2
B)33/11
C)17/112
D)None of the above
Unlock Deck
Unlock for access to all 122 flashcards in this deck.
Unlock Deck
k this deck
61
Because statistical software plays such an important role in modern statistical applications,many studies have encouraged the use of technology in statistics courses.The Guidelines for the Assessment and Instruction in Statistics Education (GAISE)(Aliaga et al. ,2005)project was funded by the American Statistical Association to examine needs for college level statistics courses.One of the six recommendations from GAISE is the use of technology for developing conceptual understanding and analyzing data.A survey was sent to students at 100 different universities across the United States to access the relationship between ease of learning the statistical software program SAS and a student's currently level of SAS proficiency.The results of the survey are published in Jackson et al. ,2011,in the International Mathematical Forum journal and are shown below. Table 1.Two-way table for ease of learning SAS and SAS proficiency level. What is the first contribution to the 2 statistic for the significance test to test for a relationship between ease of learning SAS and SAS proficiency based on the location of cell A?
A)6
B)11
C)7.2
D)None of the above
What is the first contribution to the 2 statistic for the significance test to test for a relationship between ease of learning SAS and SAS proficiency based on the location of cell A?A)6
B)11
C)7.2
D)None of the above
Unlock Deck
Unlock for access to all 122 flashcards in this deck.
Unlock Deck
k this deck
62
The Poisson distribution is a discrete distribution that expresses the probability of a fixed number of events occurring in a fixed interval.For example,suppose we want to model the number of arrivals per minute at the campus dining hall during lunch.We observe the actual arrivals in 200 one-minute periods in 1 week.The sample mean is 3.8 and the results are shown below. The probabilities based on a Poisson distribution with a mean of 3.8 are shown below. What is the value of the first contribution to the chi-square statistic for the goodness-of-fit test to the Poisson distribution using the expected count for 0 arrivals?
A)9
B)10
C)200
D)None of the above
The probabilities based on a Poisson distribution with a mean of 3.8 are shown below. What is the value of the first contribution to the chi-square statistic for the goodness-of-fit test to the Poisson distribution using the expected count for 0 arrivals?A)9
B)10
C)200
D)None of the above
Unlock Deck
Unlock for access to all 122 flashcards in this deck.
Unlock Deck
k this deck
63
Because statistical software plays such an important role in modern statistical applications,many studies have encouraged the use of technology in statistics courses.The Guidelines for the Assessment and Instruction in Statistics Education (GAISE)(Aliaga et al. ,2005)project was funded by the American Statistical Association to examine needs for college level statistics courses.One of the six recommendations from GAISE is the use of technology for developing conceptual understanding and analyzing data.A survey was sent to students at 100 different universities across the United States to access the relationship between ease of learning the statistical software program SAS and a student's currently level of SAS proficiency.The results of the survey are published in Jackson et al. ,2011,in the International Mathematical Forum journal and are shown below. Table 1.Two-way table for ease of learning SAS and SAS proficiency level. What is the expected cell count for students who find SAS difficult to learn and who are not proficient?
A)5
B)1
C)11
D)None of the above
What is the expected cell count for students who find SAS difficult to learn and who are not proficient?A)5
B)1
C)11
D)None of the above
Unlock Deck
Unlock for access to all 122 flashcards in this deck.
Unlock Deck
k this deck
64
The expected counts should be exactly equal to the observed counts for a goodness-of-fit test?
Unlock Deck
Unlock for access to all 122 flashcards in this deck.
Unlock Deck
k this deck
65
Because statistical software plays such an important role in modern statistical applications,many studies have encouraged the use of technology in statistics courses.The Guidelines for the Assessment and Instruction in Statistics Education (GAISE)(Aliaga et al. ,2005)project was funded by the American Statistical Association to examine needs for college level statistics courses.One of the six recommendations from GAISE is the use of technology for developing conceptual understanding and analyzing data.A survey was sent to students at 100 different universities across the United States to access the relationship between ease of learning the statistical software program SAS and a student's currently level of SAS proficiency.The results of the survey are published in Jackson et al. ,2011,in the International Mathematical Forum journal and are shown below. Table 1.Two-way table for ease of learning SAS and SAS proficiency level. What is the expected cell count for students who find SAS somewhat easy to learn and who are not proficient?
A)20
B)8
C)9.3
D)None of the above
What is the expected cell count for students who find SAS somewhat easy to learn and who are not proficient?A)20
B)8
C)9.3
D)None of the above
Unlock Deck
Unlock for access to all 122 flashcards in this deck.
Unlock Deck
k this deck
66
The null hypothesis for the chi-square test is that two categorical variables are _______.
A)independent
B)dependent
C)correlated
D)biased
A)independent
B)dependent
C)correlated
D)biased
Unlock Deck
Unlock for access to all 122 flashcards in this deck.
Unlock Deck
k this deck
67
A study was performed to examine the personal goals of children in grades 4,5,and 6.A random sample of students was selected from each of the grades 4,5,and 6 from schools in Georgia.The students received a questionnaire regarding achieving personal goals.They were asked what they would most like to do at school: make good grades,be good at sports,or be popular.Results are presented by the gender of the child in the table below. What is the value of the chi-square statistic based on the data presented in this table under the appropriate null hypothesis?
A)3.84
B)5.99
C)16.105
D)89.966
What is the value of the chi-square statistic based on the data presented in this table under the appropriate null hypothesis?A)3.84
B)5.99
C)16.105
D)89.966
Unlock Deck
Unlock for access to all 122 flashcards in this deck.
Unlock Deck
k this deck
68
How are expected cell counts computed in a two-way table?
A)row total × column total
B)(row total × column total)/grand total
C)grand total/(row total × column total)
D)None of the above
A)row total × column total
B)(row total × column total)/grand total
C)grand total/(row total × column total)
D)None of the above
Unlock Deck
Unlock for access to all 122 flashcards in this deck.
Unlock Deck
k this deck
69
When computing the column portions for a two-way table,the sum of the column percentages should sum to _______.
A)1
B)0
C)100
D)None of the above
A)1
B)0
C)100
D)None of the above
Unlock Deck
Unlock for access to all 122 flashcards in this deck.
Unlock Deck
k this deck
70
The Poisson distribution is a discrete distribution that expresses the probability of a fixed number of events occurring in a fixed interval.For example,suppose we want to model the number of arrivals per minute at the campus dining hall during lunch.We observe the actual arrivals in 200 one-minute periods in 1 week.The sample mean is 3.8 and the results are shown below. The probabilities based on a Poisson distribution with a mean of 3.8 are shown below. Perform a formal test to determine if the observed counts are compatible with the Poisson distribution with a mean of 3.8 and a significance level of .05.
A)The P-value is very small;therefore the observed counts are compatible with the Poisson distribution.
B)The P-value is large;therefore the observed counts are compatible with the Poisson distribution.
C)The P-value is very small;therefore the observed counts are not compatible with the Poisson distribution.
D)The P-value is large;therefore the observed counts are not compatible with the Poisson distribution.
The probabilities based on a Poisson distribution with a mean of 3.8 are shown below. Perform a formal test to determine if the observed counts are compatible with the Poisson distribution with a mean of 3.8 and a significance level of .05.A)The P-value is very small;therefore the observed counts are compatible with the Poisson distribution.
B)The P-value is large;therefore the observed counts are compatible with the Poisson distribution.
C)The P-value is very small;therefore the observed counts are not compatible with the Poisson distribution.
D)The P-value is large;therefore the observed counts are not compatible with the Poisson distribution.
Unlock Deck
Unlock for access to all 122 flashcards in this deck.
Unlock Deck
k this deck
71
Which of the following could be a 2 distribution?
A)
B)
C)
D)None of the above
A)
B)
C)
D)None of the above
Unlock Deck
Unlock for access to all 122 flashcards in this deck.
Unlock Deck
k this deck
72
Because statistical software plays such an important role in modern statistical applications,many studies have encouraged the use of technology in statistics courses.The Guidelines for the Assessment and Instruction in Statistics Education (GAISE)(Aliaga et al. ,2005)project was funded by the American Statistical Association to examine needs for college level statistics courses.One of the six recommendations from GAISE is the use of technology for developing conceptual understanding and analyzing data.A survey was sent to students at 100 different universities across the United States to access the relationship between ease of learning the statistical software program SAS and a student's currently level of SAS proficiency.The results of the survey are published in Jackson et al. ,2011,in the International Mathematical Forum journal and are shown below. Table 1.Two-way table for ease of learning SAS and SAS proficiency level. What is the expected cell count for students who find SAS very easy to learn and who are not proficient?
A)5.7
B)1
C)179.2
D)None of the above
What is the expected cell count for students who find SAS very easy to learn and who are not proficient?A)5.7
B)1
C)179.2
D)None of the above
Unlock Deck
Unlock for access to all 122 flashcards in this deck.
Unlock Deck
k this deck
73
A study was performed to examine the personal goals of children in grades 4,5,and 6.A random sample of students was selected from each of the grades 4,5,and 6 from schools in Georgia.The students received a questionnaire regarding achieving personal goals.They were asked what they would most like to do at school: make good grades,be good at sports,or be popular.Results are presented by the gender of the child in the table below. The data are going to be summarized by computing the conditional distributions of personal goals for boys and girls.What would be the entry for boys who like to make good grades?
A)0.22
B)0.43
C)0.58
D)0.70
The data are going to be summarized by computing the conditional distributions of personal goals for boys and girls.What would be the entry for boys who like to make good grades?A)0.22
B)0.43
C)0.58
D)0.70
Unlock Deck
Unlock for access to all 122 flashcards in this deck.
Unlock Deck
k this deck
74
Because statistical software plays such an important role in modern statistical applications,many studies have encouraged the use of technology in statistics courses.The Guidelines for the Assessment and Instruction in Statistics Education (GAISE)(Aliaga et al. ,2005)project was funded by the American Statistical Association to examine needs for college level statistics courses.One of the six recommendations from GAISE is the use of technology for developing conceptual understanding and analyzing data.A survey was sent to students at 100 different universities across the United States to access the relationship between ease of learning the statistical software program SAS and a student's currently level of SAS proficiency.The results of the survey are published in Jackson et al. ,2011,in the International Mathematical Forum journal and are shown below. Table 1.Two-way table for ease of learning SAS and SAS proficiency level. Perform a formal test to determine if there is a relationship between ease of learning SAS and SAS proficiency at the .05 significance level.
A)There is no relationship between ease of learning SAS and SAS proficiency.
B)There is a very weak relationship between ease of learning SAS and SAS proficiency.
C)There is a strong relationship between ease of learning SAS and SAS proficiency.
D)None of the above
Perform a formal test to determine if there is a relationship between ease of learning SAS and SAS proficiency at the .05 significance level.A)There is no relationship between ease of learning SAS and SAS proficiency.
B)There is a very weak relationship between ease of learning SAS and SAS proficiency.
C)There is a strong relationship between ease of learning SAS and SAS proficiency.
D)None of the above
Unlock Deck
Unlock for access to all 122 flashcards in this deck.
Unlock Deck
k this deck
75
The Poisson distribution is a discrete distribution that expresses the probability of a fixed number of events occurring in a fixed interval.For example,suppose we want to model the number of arrivals per minute at the campus dining hall during lunch.We observe the actual arrivals in 200 one-minute periods in 1 week.The sample mean is 3.8 and the results are shown below. The probabilities based on a Poisson distribution with a mean of 3.8 are shown below. How many degrees of freedom is the goodness-of-fit test statistic based on?
A)10
B)9
C)100
D)81
The probabilities based on a Poisson distribution with a mean of 3.8 are shown below. How many degrees of freedom is the goodness-of-fit test statistic based on?A)10
B)9
C)100
D)81
Unlock Deck
Unlock for access to all 122 flashcards in this deck.
Unlock Deck
k this deck
76
A study was performed to examine the personal goals of children in grades 4,5,and 6.A random sample of students was selected from each of the grades 4,5,and 6 from schools in Georgia.The students received a questionnaire regarding achieving personal goals.They were asked what they would most like to do at school: make good grades,be good at sports,or be popular.Results are presented by the gender of the child in the table below. What would be the null hypothesis for a chi-square test based on these data?
A)Personal goals and gender are independent.
B)The mean personal goal is the same for boys and girls.
C)The distribution of personal goals is different for boys and girls.
D)The distribution of gender is different for the three different personal goals.
What would be the null hypothesis for a chi-square test based on these data?A)Personal goals and gender are independent.
B)The mean personal goal is the same for boys and girls.
C)The distribution of personal goals is different for boys and girls.
D)The distribution of gender is different for the three different personal goals.
Unlock Deck
Unlock for access to all 122 flashcards in this deck.
Unlock Deck
k this deck
77
The Poisson distribution is a discrete distribution that expresses the probability of a fixed number of events occurring in a fixed interval.For example,suppose we want to model the number of arrivals per minute at the campus dining hall during lunch.We observe the actual arrivals in 200 one-minute periods in 1 week.The sample mean is 3.8 and the results are shown below. The probabilities based on a Poisson distribution with a mean of 3.8 are shown below. What is the expected count for 0 arrivals?
A)10
B)200
C)4
D)None of the above
The probabilities based on a Poisson distribution with a mean of 3.8 are shown below. What is the expected count for 0 arrivals?A)10
B)200
C)4
D)None of the above
Unlock Deck
Unlock for access to all 122 flashcards in this deck.
Unlock Deck
k this deck
78
Because statistical software plays such an important role in modern statistical applications,many studies have encouraged the use of technology in statistics courses.The Guidelines for the Assessment and Instruction in Statistics Education (GAISE)(Aliaga et al. ,2005)project was funded by the American Statistical Association to examine needs for college level statistics courses.One of the six recommendations from GAISE is the use of technology for developing conceptual understanding and analyzing data.A survey was sent to students at 100 different universities across the United States to access the relationship between ease of learning the statistical software program SAS and a student's currently level of SAS proficiency.The results of the survey are published in Jackson et al. ,2011,in the International Mathematical Forum journal and are shown below. Table 1.Two-way table for ease of learning SAS and SAS proficiency level. What are the degrees of freedom for the test statistic used to test for a relationship between ease of learning SAS and SAS proficiency?
A)4
B)6
C)9
D)None of the above
What are the degrees of freedom for the test statistic used to test for a relationship between ease of learning SAS and SAS proficiency?A)4
B)6
C)9
D)None of the above
Unlock Deck
Unlock for access to all 122 flashcards in this deck.
Unlock Deck
k this deck
79
Because statistical software plays such an important role in modern statistical applications,many studies have encouraged the use of technology in statistics courses.The Guidelines for the Assessment and Instruction in Statistics Education (GAISE)(Aliaga et al. ,2005)project was funded by the American Statistical Association to examine needs for college level statistics courses.One of the six recommendations from GAISE is the use of technology for developing conceptual understanding and analyzing data.A survey was sent to students at 100 different universities across the United States to access the relationship between ease of learning the statistical software program SAS and a student's currently level of SAS proficiency.The results of the survey are published in Jackson et al. ,2011,in the International Mathematical Forum journal and are shown below. Table 1.Two-way table for ease of learning SAS and SAS proficiency level. Based on examining the graphical distribution of ease of learning SAS and SAS proficiency,do you think there is a relationship between these variables?
A)No,the pattern looks completely random
B)Yes,there appears to be a relationship.SAS was easier to learn the less proficient students were at SAS.
C)Yes,there appears to be a relationship.SAS was easier to learn the more proficient students were at SAS.
D)You cannot tell from the graphs.
Based on examining the graphical distribution of ease of learning SAS and SAS proficiency,do you think there is a relationship between these variables?A)No,the pattern looks completely random
B)Yes,there appears to be a relationship.SAS was easier to learn the less proficient students were at SAS.
C)Yes,there appears to be a relationship.SAS was easier to learn the more proficient students were at SAS.
D)You cannot tell from the graphs.
Unlock Deck
Unlock for access to all 122 flashcards in this deck.
Unlock Deck
k this deck
80
What is the difference between a chi-square test for two-way tables and a chi-square test for a goodness-of-fit test?
A)Both tests are the same.
B)The chi-square test is used to compare categorical variable distributions between populations and the goodness-of-fit test is used to compare a sample from one population with a hypothesized distribution.
C)The goodness-of-fit test is used to compare categorical variable distributions between populations and the Chi-square test is used to compare a sample from one population with a hypothesized distribution.
Unlock Deck
Unlock for access to all 122 flashcards in this deck.
Unlock Deck
k this deck
Unlock Deck
Unlock for access to all 122 flashcards in this deck.


