Exam 9: Inference for Categorical Data
Exam 1: Looking at Datadistributions127 Questions
Exam 2: Looking at Datarelationships48 Questions
Exam 3: Producing Data70 Questions
Exam 4: Probability: the Study of Randomness93 Questions
Exam 5: Sampling Distributions77 Questions
Exam 6: Introduction to Inference89 Questions
Exam 7: Inference for Means103 Questions
Exam 8: Inference for Proportions101 Questions
Exam 9: Inference for Categorical Data122 Questions
Exam 10: Inference for Regression91 Questions
Exam 11: Multiple Regression95 Questions
Exam 12: One-Way Analysis of Variance74 Questions
Exam 13: Two-Way Analysis of Variance53 Questions
Exam 14: Logistic Regression53 Questions
Exam 15: Nonparametric Tests57 Questions
Exam 16: Bootstrap Methods and Permutation Tests42 Questions
Exam 17: Statistics for Quality: Control and Capability86 Questions
Select questions type
Which of the following could be a 2 distribution?
Free
(Multiple Choice)
4.8/5  (37)
(37)
Correct Answer: Verified
A
Simple random samples of 350 women and 450 men from Michigan are obtained.The 800 people in the sample are categorized according to where they went to school: in state,out of state,or no college. 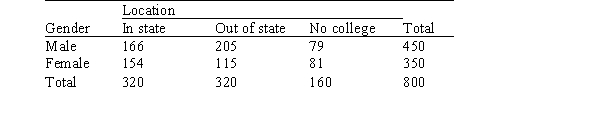 The SPSS output for the above table is given below.The output includes the cell counts and the most expected cell counts.Expected counts are printed below observed counts.
 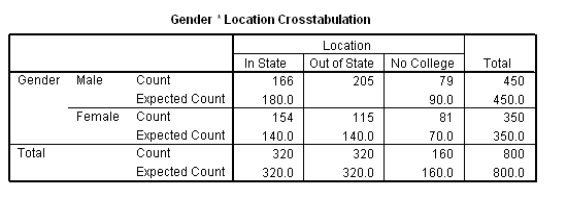 The chi-square statistic for these data equals 13.5.What do we know about the P-value for testing that there is no association between college location and gender?
Free
(Multiple Choice)
4.9/5 (34)
Correct Answer:Verified
B
Because statistical software plays such an important role in modern statistical applications,many studies have encouraged the use of technology in statistics courses.The Guidelines for the Assessment and Instruction in Statistics Education (GAISE)(Aliaga et al. ,2005)project was funded by the American Statistical Association to examine needs for college level statistics courses.One of the six recommendations from GAISE is the use of technology for developing conceptual understanding and analyzing data.A survey was sent to students at 100 different universities across the United States to access the relationship between ease of learning the statistical software program SAS and a student's currently level of SAS proficiency.The results of the survey are published in Jackson et al. ,2011,in the International Mathematical Forum journal and are shown below. Table 1.Two-way table for ease of learning SAS and SAS proficiency level. 
 What is the column proportion,H,for students who find SAS somewhat easy to learn and who are very proficient in SAS?
Free
(Multiple Choice)
4.9/5 (37)
Correct Answer:Verified
A
Because statistical software plays such an important role in modern statistical applications,many studies have encouraged the use of technology in statistics courses.The Guidelines for the Assessment and Instruction in Statistics Education (GAISE)(Aliaga et al. ,2005)project was funded by the American Statistical Association to examine needs for college level statistics courses.One of the six recommendations from GAISE is the use of technology for developing conceptual understanding and analyzing data.A survey was sent to students at 100 different universities across the United States to access the relationship between ease of learning the statistical software program SAS and a student's currently level of SAS proficiency.The results of the survey are published in Jackson et al. ,2011,in the International Mathematical Forum journal and are shown below. Table 1.Two-way table for ease of learning SAS and SAS proficiency level. 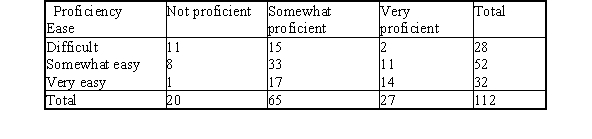
 What size table is shown above?
(Multiple Choice)
4.8/5 (30)
Because statistical software plays such an important role in modern statistical applications,many studies have encouraged the use of technology in statistics courses.The Guidelines for the Assessment and Instruction in Statistics Education (GAISE)(Aliaga et al. ,2005)project was funded by the American Statistical Association to examine needs for college level statistics courses.One of the six recommendations from GAISE is the use of technology for developing conceptual understanding and analyzing data.A survey was sent to students at 100 different universities across the United States to access the relationship between ease of learning the statistical software program SAS and a student's currently level of SAS proficiency.The results of the survey are published in Jackson et al. ,2011,in the International Mathematical Forum journal and are shown below. Table 1.Two-way table for ease of learning SAS and SAS proficiency level. 
 Which graph displays the correct distribution for comparing "very easy" ease of learning SAS and "very proficient" proficiency?
(Multiple Choice)
4.7/5 (36)
Television networks frequently run public opinion polls on issues of concern.Recently one network conducted a scientific poll asking a question concerning the approval rating of the way President Obama was handling the Iraq War.At about the same time a second network ran an online poll using a very similar question.The results of the two polls are summarized in the following table. 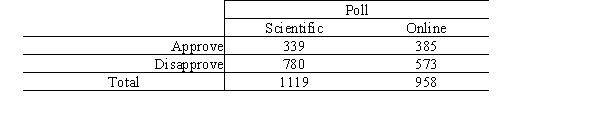 We would like to test to see if the two polls are consistent with respect to the proportion who approve of President Obama's handling of the war (i.e. ,H0:
  ). A statistic was calculated under the null hypothesis,which has the value 22.28.If the respondents in both polls can be considered to come from random samples,what is this statistic?
(Multiple Choice)
5.0/5 (33)
Which of the following statements about r × c tables is/are FALSE?
(Multiple Choice)
4.8/5 (41)
Could mud wrestling be the cause of a rash contracted by University of Washington students in the spring of 1992? Two physicians at the University of Washington student health center wondered this when one male and six female students complained of rashes after participating in a mud-wrestling event.Questionnaires were sent to all students in the residence halls who participated in the event.The questionnaire asked about the appearance of a rash and about attendance at the mud-wrestling event.The results,by gender,are summarized in the following table. 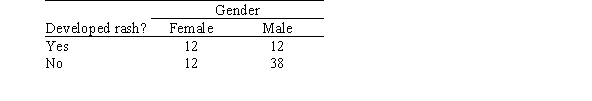 The SPSS output for the above table is given below.The output includes the cell counts,the expected cell counts,the chi-square statistic,and its degrees of freedom.Expected counts are printed below observed counts.
 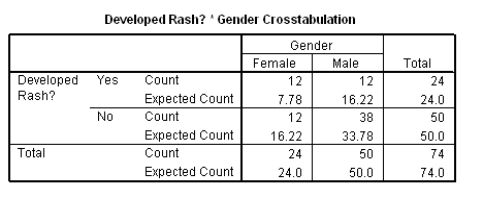 Chi-square = 2.289 + 1.098 + 1.098 + 0.527 = 5.002 df = 1,P-value = 0.0253
Which cell contributes most to the chi-square statistic?
Chi-square = 2.289 + 1.098 + 1.098 + 0.527 = 5.002 df = 1,P-value = 0.0253
Which cell contributes most to the chi-square statistic?
(Multiple Choice)
4.8/5 (25)
Television networks frequently run public opinion polls on issues of concern.One network conducted a scientific poll asking a question concerning the approval rating of the way President Obama was handling the Iraq War.At about the same time a second network ran an online poll using a very similar question.The results of the two polls are summarized in the following table. 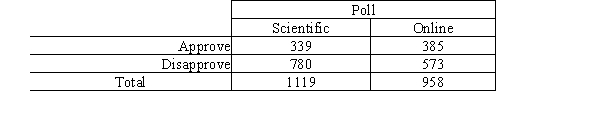 We would like to test to see if the two polls are consistent with respect to the proportion who approve of President Obama's handling of the war,i.e. ,H0:
  If the
  test is used to test the null hypothesis,the expected cell count in the online poll for those who approve and that cell's contribution to the value of the test statistic are,respectively,
(Multiple Choice)
4.8/5 (40)
Because statistical software plays such an important role in modern statistical applications,many studies have encouraged the use of technology in statistics courses.The Guidelines for the Assessment and Instruction in Statistics Education (GAISE)(Aliaga et al. ,2005)project was funded by the American Statistical Association to examine needs for college level statistics courses.One of the six recommendations from GAISE is the use of technology for developing conceptual understanding and analyzing data.A survey was sent to students at 100 different universities across the United States to access the relationship between ease of learning the statistical software program SAS and a student's currently level of SAS proficiency.The results of the survey are published in Jackson et al. ,2011,in the International Mathematical Forum journal and are shown below. Table 1.Two-way table for ease of learning SAS and SAS proficiency level. 
 What is the expected cell count for students who find SAS somewhat easy to learn and who are not proficient?
(Multiple Choice)
4.8/5 (42)
The Poisson distribution is a discrete distribution that expresses the probability of a fixed number of events occurring in a fixed interval.For example,suppose we want to model the number of arrivals per minute at the campus dining hall during lunch.We observe the actual arrivals in 200 one-minute periods in 1 week.The sample mean is 3.8 and the results are shown below. 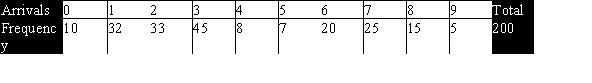 The probabilities based on a Poisson distribution with a mean of 3.8 are shown below.
 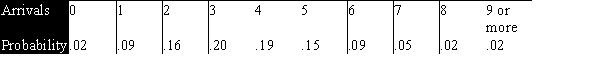 What is the value of the first contribution to the chi-square statistic for the goodness-of-fit test to the Poisson distribution using the expected count for 0 arrivals?
(Multiple Choice)
4.8/5 (31)
Even though Puerto Rico is a commonwealth of the United States,there are many cultural differences between the states on the continent and the island of Puerto Rico.These differences include the way consumers handle problems with purchases.Two researchers surveyed owners of DVD players in the Northeast United States and in Puerto Rico.They asked those who had experienced problems with their DVD players whether they complained.The results are given in the table below. 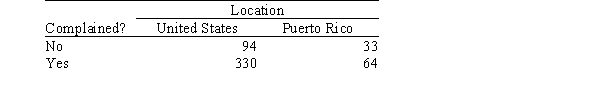 The SPSS output for the above table is given below.The output includes the cell counts,the expected cell counts,and the chi-square statistic.Expected counts are printed below observed counts.
 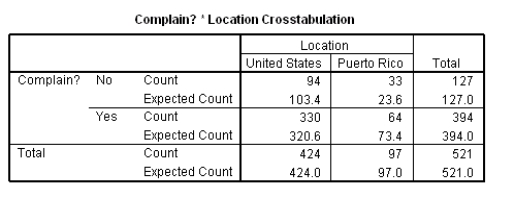 Chi-square = 0.855 + 3.744 + 0.276 + 1.204 = 6.079 What proportion of Puerto Ricans did not complain?
(Multiple Choice)
4.8/5 (25)
When a police officer responds to a call for help in a case of spousal abuse,what should the officer do? A randomized controlled experiment in Charlotte,North Carolina,studied three police responses to spousal abuse: advise and possibly separate the couple,issue a citation to the offender,and arrest the offender.The effectiveness of the three responses was determined by re-arrest rates.The table below shows these rates. 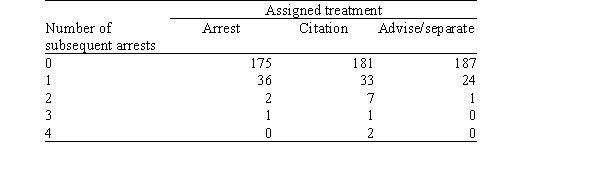 Suppose we wish to test the null hypothesis that the proportions of subsequent arrests are the same regardless of the treatment assigned.Under the null hypothesis,what is the expected number of times no subsequent arrest would occur for the treatment "Advise/separate"?
(Multiple Choice)
4.9/5 (29)
There was a wonderful study conducted in 1898 by von Bortkiewicz,which provides data on the death of soldiers in the Prussian army from kicks by horses and mules.The data pertain to 10 army corps,each observed over 20 years,for a total of 200 corps-years.The following table summarizes the observed data.Note that 109 corps-years had 0 deaths and 65 corps-years had 1 death,etc. 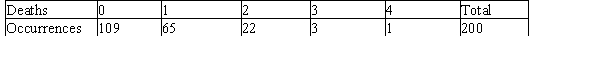 Von Bortkiewicz felt that a distribution known as the Poisson distribution would describe these data well.Using that distribution,he produced the following probabilities.
 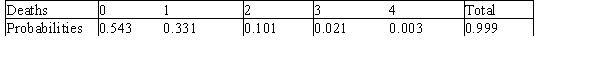 Under the null hypothesis that the observed cell counts follow the specified distribution,what is the expected number of corps-years in which one death occurred due to horse or mule kicks?
(Multiple Choice)
4.8/5 (37)
Prior to graduation,a high school class was surveyed about their plans after high school.The table below displays the results by gender. 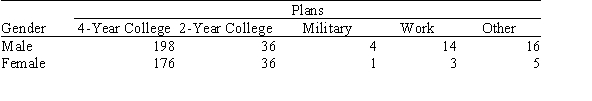 Suppose we wish to test the null hypothesis that there is no association between plans after high school and gender.Under the null hypothesis,what is the expected number of female students who are planning to work?
(Multiple Choice)
4.9/5 (26)
The null hypothesis for the chi-square test is that two categorical variables are _______.
(Multiple Choice)
4.8/5 (33)
Which of the following statements about the analysis of two-way tables is/are TRUE?
(Multiple Choice)
4.9/5 (35)
Because statistical software plays such an important role in modern statistical applications,many studies have encouraged the use of technology in statistics courses.The Guidelines for the Assessment and Instruction in Statistics Education (GAISE)(Aliaga et al. ,2005)project was funded by the American Statistical Association to examine needs for college level statistics courses.One of the six recommendations from GAISE is the use of technology for developing conceptual understanding and analyzing data.A survey was sent to students at 100 different universities across the United States to access the relationship between ease of learning the statistical software program SAS and a student's currently level of SAS proficiency.The results of the survey are published in Jackson et al. ,2011,in the International Mathematical Forum journal and are shown below. Table 1.Two-way table for ease of learning SAS and SAS proficiency level. 
 The letters J,K,and L represent the ______ distribution for ease of learning SAS.
(Multiple Choice)
4.9/5 (34)
Filters
- Essay(0)
- Multiple Choice(0)
- Short Answer(0)
- True False(0)
- Matching(0)