Deck 12: Monetary Policy and the Phillips Curve
Full screen (f)
Question
Question
Refer to the following figure when answering the following questions.
Figure 12.2: IS-MP Curve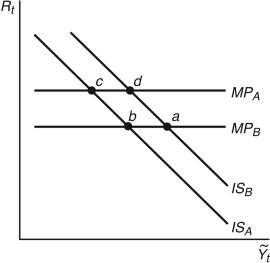
Consider Figure 12.2. If the Fed raises interest rates and there are no aggregate demand shocks, the economy moves from:
A) point b to d
B) point b to a
C) point b to c
D) point c to d
E) Not enough information is given.
Figure 12.2: IS-MP Curve
Consider Figure 12.2. If the Fed raises interest rates and there are no aggregate demand shocks, the economy moves from:
A) point b to d
B) point b to a
C) point b to c
D) point c to d
E) Not enough information is given.
Question
Question
Figure 12.1: MP Curve 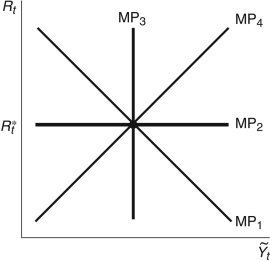
In Figure 12.1, if the Federal Reserve sets the real interest rate at , which line represents the MP curve?
A)
B)
C)
D)
E) Not enough information is given.
In Figure 12.1, if the Federal Reserve sets the real interest rate at
, which line represents the MP curve?A)
B)
C)
D)
E) Not enough information is given.
Question
Question
The equation  is called the ________ and
Is the ________.
A) risk premium; discount rate
B) ex ante real interest rate; ex post real interest rate
C) bond yield; real interest rate
D) ex ante nominal interest rate; nominal interest rate
E) nominal interest rate; real interest rate
is called the ________ and Is the ________.
A) risk premium; discount rate
B) ex ante real interest rate; ex post real interest rate
C) bond yield; real interest rate
D) ex ante nominal interest rate; nominal interest rate
E) nominal interest rate; real interest rate
Question
Question
Question
Question
Question
Question
Question
Question
Question
Question
Which of the following is the Fisher equation?
A)
B)
C)
D)
E)
A)
B)
C)
D)
E)
Question
Question
Question
Question
Question
Question
Question
Refer to the following figure when answering the following questions.
Figure 12.3: Yield Curves December 4, 2006 and 2012
Consider the yield curves in Figure 12.3. The curve for 12/4/2012 is unusual because:
A) it has no relationship to the real economy.
B) its short-term interest rates are lower than long-term interest rates.
C) It is not unusual.
D) it is lower than the yield curve for 2006.
E) it is generally very low.
Question
Refer to the following figure when answering the following questions.
Figure 12.2: IS-MP Curve
Consider Figure 12.2. If there is a sharp increase in consumer confidence, the economy moves from point ________. To prevent a ________, the Fed ________, and the economy moves from point ________.
A) a to d; recession; lowers interest rates; d to b
B) a to d; recession; lowers interest rates; d to c
C) c to b; bubble; raises interest rates; b to c
D) d to c; recession; lowers interest rates; c to b
E) b to a; bubble; raises interest rates; a to d
Question
Question
In the text, inflation is given by the equation ________, where  is the current price level and
is the future price level.
A)
B)
C)
D)
E)
is the current price level and is the future price level.
A)
B)
C)
D)
E)
Question
Question
Refer to the following figure when answering the following questions.
Figure 12.2: IS-MP Curve
Consider Figure 12.2. If the Fed lowers interest rates and there are no aggregate demand shocks, the economy moves from point ________ to ________.
A) e; b
B) d; c
C) d; a
D) e; d
E) Not enough information is given.
Figure 12.2: IS-MP Curve
Consider Figure 12.2. If the Fed lowers interest rates and there are no aggregate demand shocks, the economy moves from point ________ to ________.
A) e; b
B) d; c
C) d; a
D) e; d
E) Not enough information is given.
Question
Question
Question
Refer to the following figure when answering the following questions.
Figure 12.3: Yield Curves December 4, 2006 and 2012
Consider the yield curves in Figure 12.3. The curve for 12/4/2006 is unusual because:
A) it has no relationship to the real economy.
B) its short-term interest rates are higher than long-term interest rates.
C) it is inverted.
D) it is higher than the yield curve for 2012.
E) It is not unusual.
Question
Question
Refer to the following figure when answering the following questions.
Figure 12.2: IS-MP Curve
Consider Figure 12.2. If the stock market drops sharply, there is a loss in consumer and investor confidence and the economy moves from point ________. To prevent a ________, the Fed ________, and the economy moves from point ________.
A) a to d; recession; lowers interest rates; d to b
B) d to c; recession; lowers interest rates; c to b
C) c to b; bubble; raises interest rates; b to c
D) a to d; recession; lowers interest rates; d to c
E) Not enough information is given.
Question
Refer to the following figure when answering the following questions.
Figure 12.2: IS-MP Curve
Consider Figure 12.2. If the Fed lowers interest rates and there are no aggregate demand shocks, the economy moves from point ________ to ________.
A) d; a
B) c; a
C) a; b
D) d; c
E) None of these answers is correct.
Figure 12.2: IS-MP Curve
Consider Figure 12.2. If the Fed lowers interest rates and there are no aggregate demand shocks, the economy moves from point ________ to ________.
A) d; a
B) c; a
C) a; b
D) d; c
E) None of these answers is correct.
Question
The economywide rate of inflation is given by:
A) .
.
B) .
.
C) .
.
D) .
.
E) .
.
A)
.B)
.C)
.D)
.E)
. Question
Question
Question
Refer to the following figure when answering the following questions.
Figure 12.2: IS-MP Curve
Consider Figure 12.2. If housing prices drop sharply, there is a loss in consumer and investor confidence and the economy moves from point ________. To prevent a ________, the Fed ________, and the economy moves from point ________.
A) a to d; recession; lowers interest rates; d to b
B) a to d; recession; lowers interest rates; d to c
C) c to b; bubble; raises interest rates; b to c
D) d to c; recession; lowers interest rates; c to b
E) Not enough information is given.
Question
Question
Question
Question
Question
Question
In the Phillips curve, the term ________ reflects ________.
A) ; cost-push inflation
B) ; cost-push inflation
C) ; the "true" rate of inflation
D) ; demand-pull inflation
E) ; the responsiveness of inflation to cost shocks
A)
; cost-push inflationB)
; cost-push inflationC)
; the "true" rate of inflationD)
; demand-pull inflationE)
; the responsiveness of inflation to cost shocks Question
Figure 12.6: IS-MP Curve 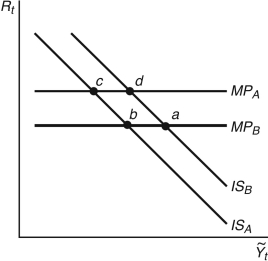
Start from any equilibrium in Figure 12.6 to answer the following question. In 1980, U.S. inflation hit about 14 percent; Federal Reserve chairman ________ engineered a decline in inflation by ________ rates, shown in the figure as movement from point ________.
A) Volcker; raising inflation; b to c
B) Bernanke; raising interest; b to d
C) Volcker; lowering interest; c to b
D) Volcker; raising interest; b to c
E) Greenspan; lowering interest; a to b
Question
In the Phillips curve  measures:
A) a price shock.
B) how sensitive inflation is to interest rates.
C) how sensitive inflation is to aggregate demand conditions.
D) how sensitive inflation is to aggregate supply conditions.
E) how sensitive inflation is to price shocks.
measures:A) a price shock.
B) how sensitive inflation is to interest rates.
C) how sensitive inflation is to aggregate demand conditions.
D) how sensitive inflation is to aggregate supply conditions.
E) how sensitive inflation is to price shocks.
Question
With adaptive expectations, the Phillips curve can be written as:
A) .
.
B) .
.
C) .
.
D) .
.
E) .
.
A)
.B)
.C)
.D)
.E)
. Question
In the Phillips curve  is:
is:
A) a demand shock.
B) an inflation shock.
C) a measure of the sensitivity of inflation to demand conditions.
D) a permanent price trend.
E) fiscal policy shock.
is:A) a demand shock.
B) an inflation shock.
C) a measure of the sensitivity of inflation to demand conditions.
D) a permanent price trend.
E) fiscal policy shock.
Question
Refer to the following figure when answering the following questions.
Figure 12.4: Phillips Curve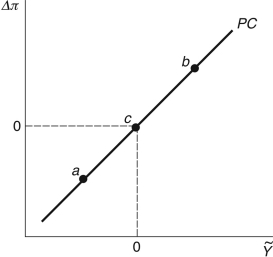
Consider the Phillips curve in Figure 12.4. At point a, the economy is ________; at point c, the economy is ________.
A) in recession; booming
B) in recession; in recession
C) in recession; in its long-run equilibrium
D) booming; in recession
E) in its long-run equilibrium; in recession
Question
Question
Question
In the Phillips curve  is a:
is a:
A) temporary demand shock.
B) permanent price change.
C) temporary cost shock.
D) temporary unemployment shock.
E) structural macroeconomic change.
is a:A) temporary demand shock.
B) permanent price change.
C) temporary cost shock.
D) temporary unemployment shock.
E) structural macroeconomic change.
Question
In the Phillips curve,  , if
, if 
Is large, then:
A) price-setting behavior is completely insensitive to short-run fluctuations.
B) price-setting behavior is very insensitive to short-run fluctuations.
C) inflation is not very sensitive to short-run fluctuations.
D) price-setting behavior is very sensitive to short-run fluctuations.
E) Not enough information is given.
, if Is large, then:
A) price-setting behavior is completely insensitive to short-run fluctuations.
B) price-setting behavior is very insensitive to short-run fluctuations.
C) inflation is not very sensitive to short-run fluctuations.
D) price-setting behavior is very sensitive to short-run fluctuations.
E) Not enough information is given.
Question
Question
Question
Refer to the following figure when answering the following questions.
Figure 12.4: Phillips Curve
Consider the Phillips curve in Figure 12.4. At point b, the economy is ________, and at point a, the economy is ________.
A) in recession; booming
B) in recession; in its long-run equilibrium
C) in recession; in recession
D) booming; in recession
E) in its long-run equilibrium; in recession
Question
Question
In the Phillips curve, the term ________ reflects ________.
A) demand-pull inflation
B) ; cost-push inflation
C) ; the "true" rate of inflation
D) ; demand-pull inflation
E) the responsiveness of inflation to cost shocks
A)
demand-pull inflationB)
; cost-push inflationC)
; the "true" rate of inflationD)
; demand-pull inflationE)
the responsiveness of inflation to cost shocks Question
Question
Question
Figure 12.8: Output 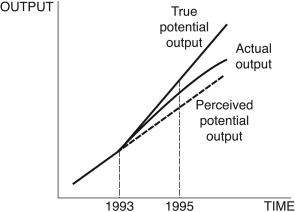
Consider Figure 12.8. You are chairman of the Federal Reserve in 1995. You believe potential output follows the dotted line after 1993, but in actuality, it follows the line denoted "True potential output." The current state of the economy is given by the curve "Actual output." Given the information in the figure, you ________, because you believe the economy is in a ________, but your advice instead ________.
A) lower interest rates; recession; accelerates inflation
B) raise interest rates; boom; accelerates a recession
C) keep interest rates the same; boom; accelerates inflation
D) lower interest rates; boom; increases unemployment
E) Not enough information is given.
Question
Question
Refer to the following figure when answering the following questions.
Figure 12.9: Change in Inflation by Quarter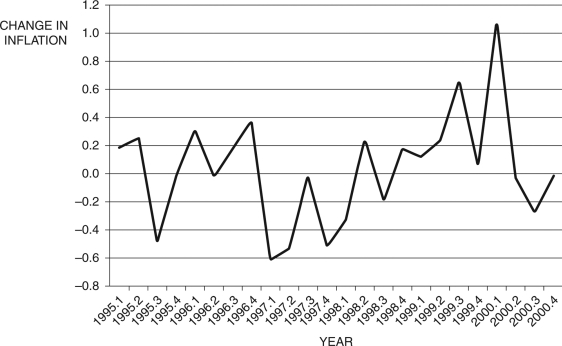
Consider Figure 12.9. You are Federal Reserve chairman Greenspan and today's date is the second quarter of 1997 (1997.2). Given the information you have, using the Phillips curve, to stabilize the economy you would ________ interest rates, risking ________.
A) raise; recession
B) raise; inflation
C) lower; inflation
D) lower; higher unemployment
E) Not enough information is given.
Question
Question
Question
Which of the following scenarios best describes the short-run model?
A)
B)
C)
D)
E) None of these answers is correct.
A)
B)
C)
D)
E) None of these answers is correct.
Question
Refer to the following figure when answering the following questions.
Figure 12.9: Change in Inflation by Quarter
Consider Figure 12.9. You are Federal Reserve chairman Greenspan and today's date is the first quarter of 1999 (1999.1). Given the information you have, using the Phillips curve, to stabilize the economy you would ________ interest rates, risking ________.
A) raise; inflation
B) raise; recession
C) lower; recession
D) lower; higher unemployment
E) Not enough information is given.
Question
Question
Refer to the following figure when answering the following questions.
Figure 12.11: Change in Inflation by Month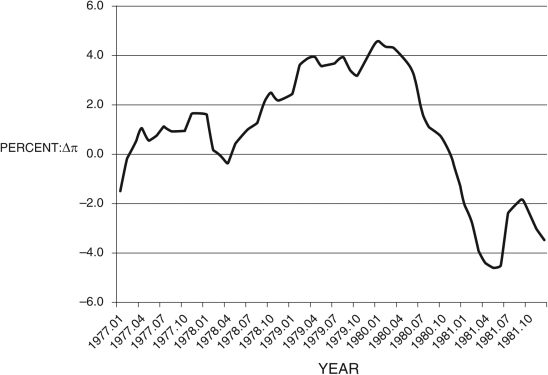
Consider Figure 12.11. You are Federal Reserve chairman Volcker and today's date is the first quarter of 1980 (1980.1). You suggest the appropriate policy would be to ________. In the second quarter of 1981, you consider your performance, and you conclude that you ________; using the Phillips curve, you see the country is now ________.
A) lower taxes; failed to tame inflation; in debt
B) lower interest rates; failed at taming inflation; in a recession
C) raise interest rates; succeeded in taming the recession; booming
D) raise interest rates; succeeded in taming inflation; in a recession
E) raise taxes; succeeded in taming inflation; in debt
Question
Question
Question
Figure 12.7: Output 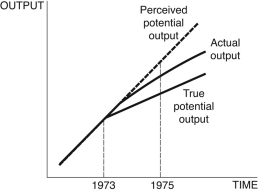
Consider Figure 12.7. You are chairman of the Federal Reserve in 1975. You believe potential output follows the dotted line after 1973, but in actuality, it follows the line denoted "True potential output." The current state of the economy is given by the curve "Actual output." Given the information in the figure, you ________, because you believe the economy is in a ________, but your advice instead ________.
A) lower interest rates; recession; accelerates inflation
B) raise interest rates; recession; accelerates inflation
C) keep interest rates the same; boom; accelerates inflation
D) lower interest rates; boom; increases unemployment
E) Not enough information is given.
Question
Question
Refer to the following figure when answering the following questions.
Figure 12.10: Output Gap: 1990-2000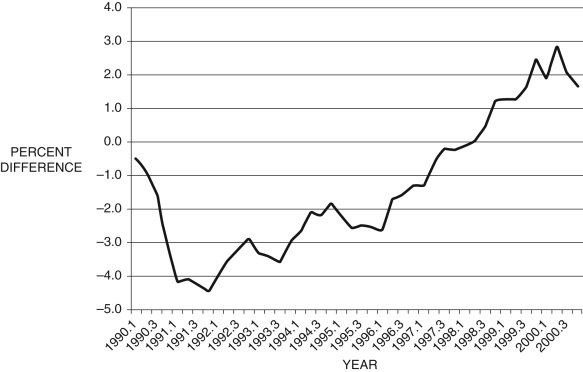
-Consider Figure 12.10, which shows the output gap from 1990 to 2000, by quarter. If this is all the information you have, during the period 1997.1-1999.4, from the Phillips curve, you would conclude that:
A) inflation is accelerating, 0.
B) inflation is decelerating, 0.
C) unemployment is falling.
D) unemployment is rising.
E) Not enough information is given.
Figure 12.10: Output Gap: 1990-2000
-Consider Figure 12.10, which shows the output gap
from 1990 to 2000, by quarter. If this is all the information you have, during the period 1997.1-1999.4, from the Phillips curve, you would conclude that:A) inflation is accelerating, 0.
B) inflation is decelerating, 0.
C) unemployment is falling.
D) unemployment is rising.
E) Not enough information is given.
Question
Refer to the following figure when answering the following questions.
Figure 12.10: Output Gap: 1990-2000
-Consider Figure 12.10, which shows the output gap from 1990 to 2000, by quarter. If this is all the information you have, during the period 1993.1-1993.4, from the Phillips curve, you would conclude that:
A) inflation is decelerating, 0.
B) inflation is accelerating, 0.
C) unemployment is falling.
D) unemployment is rising.
E) Not enough information is given.
Figure 12.10: Output Gap: 1990-2000
-Consider Figure 12.10, which shows the output gap
from 1990 to 2000, by quarter. If this is all the information you have, during the period 1993.1-1993.4, from the Phillips curve, you would conclude that:A) inflation is decelerating, 0.
B) inflation is accelerating, 0.
C) unemployment is falling.
D) unemployment is rising.
E) Not enough information is given.
Question
Which of the following scenarios best describes the short-run model?
A)
B)
C)
D)
E) None of these answers is correct.
A)
B)
C)
D)
E) None of these answers is correct.
Question
Question
Refer to the following figure when answering the following questions.
Figure 12.11: Change in Inflation by Month
Consider Figure 12.11. You are Federal Reserve chairman Volcker and today's date is mid-1977. You suggest the appropriate policy would be to ________. You reevaluate your policy in mid-1979 and conclude that you ________; using the Phillips curve, you see the country is now in ________.
A) lower taxes; failed to tame inflation; debt
B) lower interest rates; failed at taming inflation; a recession
C) raise interest rates; failed at taming inflation; expansion
D) raise interest rates; succeeded in taming inflation; a recession
E) raise taxes; succeeded in taming inflation; debt
Question
Refer to the following figure when answering the following questions.
Figure 12.9: Change in Inflation by Quarter
Consider Figure 12.9. You are Federal Reserve chairman Greenspan and today's date is the fourth quarter of 1997 (1997.4). Given the information you have, using the Phillips curve, to stabilize the economy you would ________ interest rates, risking ________.
A) raise; inflation
B) lower; inflation
C) raise; recession
D) lower; higher unemployment
E) Not enough information is given.
Question

Unlock Deck
Sign up to unlock the cards in this deck!
Unlock Deck
Unlock Deck
1/135
Play
Full screen (f)
Deck 12: Monetary Policy and the Phillips Curve
1
Between 2009 and 2015, the federal funds rate was roughly equal to:
A) 0.5 percent.
B) zero.
C) 2 percent.
D) the rate of inflation.
E) the unemployment rate.
A) 0.5 percent.
B) zero.
C) 2 percent.
D) the rate of inflation.
E) the unemployment rate.
zero.
2
Refer to the following figure when answering the following questions.
Figure 12.2: IS-MP Curve
Consider Figure 12.2. If the Fed raises interest rates and there are no aggregate demand shocks, the economy moves from:
A) point b to d
B) point b to a
C) point b to c
D) point c to d
E) Not enough information is given.
Figure 12.2: IS-MP Curve
Consider Figure 12.2. If the Fed raises interest rates and there are no aggregate demand shocks, the economy moves from:
A) point b to d
B) point b to a
C) point b to c
D) point c to d
E) Not enough information is given.
point b to c
3
Which of the following is the mission of the Federal Reserve Bank?
i. Preserve price stability
ii. Foster economic growth and employment
iii. Ensure taxes are fair
A) i only
B) ii only
C) iii only
D) i and ii
E) i and iii
i. Preserve price stability
ii. Foster economic growth and employment
iii. Ensure taxes are fair
A) i only
B) ii only
C) iii only
D) i and ii
E) i and iii
i and ii
4
Figure 12.1: MP Curve
In Figure 12.1, if the Federal Reserve sets the real interest rate at , which line represents the MP curve?
A)
B)
C)
D)
E) Not enough information is given.
In Figure 12.1, if the Federal Reserve sets the real interest rate at
, which line represents the MP curve?A)
B)
C)
D)
E) Not enough information is given.
Unlock Deck
Unlock for access to all 135 flashcards in this deck.
Unlock Deck
k this deck
5
What is the main policy tool available to the Federal Reserve?
A) the reserve rate
B) the discount rate
C) the federal funds rate
D) printing money
E) the mortgage rate
A) the reserve rate
B) the discount rate
C) the federal funds rate
D) printing money
E) the mortgage rate
Unlock Deck
Unlock for access to all 135 flashcards in this deck.
Unlock Deck
k this deck
6
The equation is called the ________ and
Is the ________.
A) risk premium; discount rate
B) ex ante real interest rate; ex post real interest rate
C) bond yield; real interest rate
D) ex ante nominal interest rate; nominal interest rate
E) nominal interest rate; real interest rate
is called the ________ and Is the ________.
A) risk premium; discount rate
B) ex ante real interest rate; ex post real interest rate
C) bond yield; real interest rate
D) ex ante nominal interest rate; nominal interest rate
E) nominal interest rate; real interest rate
Unlock Deck
Unlock for access to all 135 flashcards in this deck.
Unlock Deck
k this deck
7
According to the Fisher equation, the nominal interest rate is equal to the:
A) rate of inflation.
B) real interest rate minus the rate of inflation.
C) real interest rate plus the rate of inflation.
D) rate of unemployment.
E) real interest rate plus short-run economic fluctuations.
A) rate of inflation.
B) real interest rate minus the rate of inflation.
C) real interest rate plus the rate of inflation.
D) rate of unemployment.
E) real interest rate plus short-run economic fluctuations.
Unlock Deck
Unlock for access to all 135 flashcards in this deck.
Unlock Deck
k this deck
8
Which of the following is the mission of the Federal Reserve Bank?
i. Preserve price stability
ii. Foster stable fiscal policy
iii. Ensure taxes are fair
A) ii only
B) i only
C) iii only
D) i and ii
E) i and iii
i. Preserve price stability
ii. Foster stable fiscal policy
iii. Ensure taxes are fair
A) ii only
B) i only
C) iii only
D) i and ii
E) i and iii
Unlock Deck
Unlock for access to all 135 flashcards in this deck.
Unlock Deck
k this deck
9
What is the main policy tool available to the Federal Reserve?
A) the discount rate
B) the federal funds rate
C) government expenditures
D) printing money
E) taxes
A) the discount rate
B) the federal funds rate
C) government expenditures
D) printing money
E) taxes
Unlock Deck
Unlock for access to all 135 flashcards in this deck.
Unlock Deck
k this deck
10
When economists say "sticky inflation," they mean:
A) inflation does not immediately react to changes in monetary policy.
B) inflation adjusts quickly.
C) inflation does not react directly to changes in fiscal policy.
D) taxes do not react to changes in prices.
E) inflation never responds to monetary policy.
A) inflation does not immediately react to changes in monetary policy.
B) inflation adjusts quickly.
C) inflation does not react directly to changes in fiscal policy.
D) taxes do not react to changes in prices.
E) inflation never responds to monetary policy.
Unlock Deck
Unlock for access to all 135 flashcards in this deck.
Unlock Deck
k this deck
11
According to the Fisher equation, the real interest rate is given by:
A) zero.
B) the nominal interest rate plus the rate of inflation.
C) the nominal interest rate minus the rate of unemployment.
D) the rate of economic growth.
E) the nominal interest rate minus the rate of inflation.
A) zero.
B) the nominal interest rate plus the rate of inflation.
C) the nominal interest rate minus the rate of unemployment.
D) the rate of economic growth.
E) the nominal interest rate minus the rate of inflation.
Unlock Deck
Unlock for access to all 135 flashcards in this deck.
Unlock Deck
k this deck
12
The link between real and nominal interest rates is summarized in:
A) the MP curve.
B) the Phillips curve.
C) Okun's law.
D) the Fisher equation.
E) Jones's equality.
A) the MP curve.
B) the Phillips curve.
C) Okun's law.
D) the Fisher equation.
E) Jones's equality.
Unlock Deck
Unlock for access to all 135 flashcards in this deck.
Unlock Deck
k this deck
13
An implication of sticky inflation is that, through monetary policy changes, the Federal Reserve (the Fed):
A) has no impact on inflation.
B) can alter the real interest rate in the long run.
C) can alter the real interest rate in the short run.
D) has no impact on the real interest rate.
E) has no impact on the unemployment rate.
A) has no impact on inflation.
B) can alter the real interest rate in the long run.
C) can alter the real interest rate in the short run.
D) has no impact on the real interest rate.
E) has no impact on the unemployment rate.
Unlock Deck
Unlock for access to all 135 flashcards in this deck.
Unlock Deck
k this deck
14
The MP curve stands for ________ and describes how ________.
A) monopoly pricing; firms set prices
B) monetary policy; the Federal Reserve sets the inflation rate
C) monetary policy; the federal government sets short-run output fluctuations
D) money prices; the Federal Reserve sets the inflation rate
E) monetary policy; the Federal Reserve sets the nominal interest rate
Unlock Deck
Unlock for access to all 135 flashcards in this deck.
Unlock Deck
k this deck
15
If we replace the actual rate of inflation with the expected inflation rate in the Fisher equation, we get the:
A) risk premium.
B) rational expectations level of inflation.
C) discount rate.
D) ex ante real interest rate.
E) ex post nominal interest rate.
A) risk premium.
B) rational expectations level of inflation.
C) discount rate.
D) ex ante real interest rate.
E) ex post nominal interest rate.
Unlock Deck
Unlock for access to all 135 flashcards in this deck.
Unlock Deck
k this deck
16
Which of the following is the Fisher equation?
A)
B)
C)
D)
E)
A)
B)
C)
D)
E)
Unlock Deck
Unlock for access to all 135 flashcards in this deck.
Unlock Deck
k this deck
17
What was unusual about the federal funds rate post-2009?
A) It was over 15 percent.
B) It equaled the rate of inflation.
C) It was roughly equal to zero.
D) It was negative.
E) It was exactly equal to the Taylor Rule.
A) It was over 15 percent.
B) It equaled the rate of inflation.
C) It was roughly equal to zero.
D) It was negative.
E) It was exactly equal to the Taylor Rule.
Unlock Deck
Unlock for access to all 135 flashcards in this deck.
Unlock Deck
k this deck
18
The federal funds rate is:
A) equal to the rate of inflation.
B) the interest rate at which banks borrow from the Federal Reserve.
C) the interest rate at which banks borrow from and loan to each other overnight.
D) an interest rate that is some fixed amount above the prime lending rate.
E) the return to stock markets over the long term.
Unlock Deck
Unlock for access to all 135 flashcards in this deck.
Unlock Deck
k this deck
19
Which of the following is the mission of the Federal Reserve Bank?
i. Preserve price stability
ii. Foster economic growth and employment
iii. Promote a stable financial system
A) i only
B) ii only
C) iii only
D) i, ii, and iii
E) i and ii
i. Preserve price stability
ii. Foster economic growth and employment
iii. Promote a stable financial system
A) i only
B) ii only
C) iii only
D) i, ii, and iii
E) i and ii
Unlock Deck
Unlock for access to all 135 flashcards in this deck.
Unlock Deck
k this deck
20
A key assumption of the short-run model is:
A) zero inflation.
B) perfect price flexibility.
C) that unemployment always equals its natural rate.
D) that the economy never deviates from its long-run equilibrium.
E) sticky inflation.
A) zero inflation.
B) perfect price flexibility.
C) that unemployment always equals its natural rate.
D) that the economy never deviates from its long-run equilibrium.
E) sticky inflation.
Unlock Deck
Unlock for access to all 135 flashcards in this deck.
Unlock Deck
k this deck
21
An inverted yield curve is usually the result of:
A) a devaluing currency.
B) the time value of money.
C) a present-value calculation.
D) greater uncertainty in the future.
E) the Fed fighting inflation.
A) a devaluing currency.
B) the time value of money.
C) a present-value calculation.
D) greater uncertainty in the future.
E) the Fed fighting inflation.
Unlock Deck
Unlock for access to all 135 flashcards in this deck.
Unlock Deck
k this deck
22
If prices are sticky and there are no aggregate demand shocks, and if the Fed raises the interest rate, ________ and ________.
A) unemployment falls; potential output falls
B) the real interest rate falls; short-run output falls
C) the unemployment rate rises; short-run output rises
D) the real interest rate rises; short-run output falls
E) the real interest rate falls; current output falls
A) unemployment falls; potential output falls
B) the real interest rate falls; short-run output falls
C) the unemployment rate rises; short-run output rises
D) the real interest rate rises; short-run output falls
E) the real interest rate falls; current output falls
Unlock Deck
Unlock for access to all 135 flashcards in this deck.
Unlock Deck
k this deck
23
Refer to the following figure when answering the following questions.
Figure 12.3: Yield Curves December 4, 2006 and 2012
Consider the yield curves in Figure 12.3. The curve for 12/4/2012 is unusual because:
A) it has no relationship to the real economy.
B) its short-term interest rates are lower than long-term interest rates.
C) It is not unusual.
D) it is lower than the yield curve for 2006.
E) it is generally very low.
Unlock Deck
Unlock for access to all 135 flashcards in this deck.
Unlock Deck
k this deck
24
Refer to the following figure when answering the following questions.
Figure 12.2: IS-MP Curve
Consider Figure 12.2. If there is a sharp increase in consumer confidence, the economy moves from point ________. To prevent a ________, the Fed ________, and the economy moves from point ________.
A) a to d; recession; lowers interest rates; d to b
B) a to d; recession; lowers interest rates; d to c
C) c to b; bubble; raises interest rates; b to c
D) d to c; recession; lowers interest rates; c to b
E) b to a; bubble; raises interest rates; a to d
Unlock Deck
Unlock for access to all 135 flashcards in this deck.
Unlock Deck
k this deck
25
The term structure of interest rates shows the relationship between:
A) corporate bonds and the federal funds rate.
B) high and low quality corporate bonds.
C) U.S. Treasury bills with different maturities.
D) U.S. Treasury rates and municipal bond yields.
E) mortgage rates and LIBOR.
A) corporate bonds and the federal funds rate.
B) high and low quality corporate bonds.
C) U.S. Treasury bills with different maturities.
D) U.S. Treasury rates and municipal bond yields.
E) mortgage rates and LIBOR.
Unlock Deck
Unlock for access to all 135 flashcards in this deck.
Unlock Deck
k this deck
26
In the text, inflation is given by the equation ________, where is the current price level and
is the future price level.
A)
B)
C)
D)
E)
is the current price level and is the future price level.
A)
B)
C)
D)
E)
Unlock Deck
Unlock for access to all 135 flashcards in this deck.
Unlock Deck
k this deck
27
Expected inflation is:
A) equal to zero.
B) equal to the real interest rate.
C) equal to future periods' inflation rates.
D) the rate of inflation that firms believe will prevail in macroeconomy.
E) about 2 percent.
A) equal to zero.
B) equal to the real interest rate.
C) equal to future periods' inflation rates.
D) the rate of inflation that firms believe will prevail in macroeconomy.
E) about 2 percent.
Unlock Deck
Unlock for access to all 135 flashcards in this deck.
Unlock Deck
k this deck
28
Refer to the following figure when answering the following questions.
Figure 12.2: IS-MP Curve
Consider Figure 12.2. If the Fed lowers interest rates and there are no aggregate demand shocks, the economy moves from point ________ to ________.
A) e; b
B) d; c
C) d; a
D) e; d
E) Not enough information is given.
Figure 12.2: IS-MP Curve
Consider Figure 12.2. If the Fed lowers interest rates and there are no aggregate demand shocks, the economy moves from point ________ to ________.
A) e; b
B) d; c
C) d; a
D) e; d
E) Not enough information is given.
Unlock Deck
Unlock for access to all 135 flashcards in this deck.
Unlock Deck
k this deck
29
Adaptive expectations imply that firms:
A) adapt their prices to what the Fed does.
B) constantly update their inflation expectations.
C) slowly adjust their inflation expectations.
D) base prices on the rate of unemployment.
E) always know what the rate of inflation is.
A) adapt their prices to what the Fed does.
B) constantly update their inflation expectations.
C) slowly adjust their inflation expectations.
D) base prices on the rate of unemployment.
E) always know what the rate of inflation is.
Unlock Deck
Unlock for access to all 135 flashcards in this deck.
Unlock Deck
k this deck
30
In a weakening economy, you might expect producers to:
A) lower wages to increase quantity demand for their output.
B) lower prices to increase quantity demand for their output.
C) increase prices to increase quantity demand for their output.
D) lower prices to reduce quantity demand for their output.
E) raise wages to hire more productive workers.
A) lower wages to increase quantity demand for their output.
B) lower prices to increase quantity demand for their output.
C) increase prices to increase quantity demand for their output.
D) lower prices to reduce quantity demand for their output.
E) raise wages to hire more productive workers.
Unlock Deck
Unlock for access to all 135 flashcards in this deck.
Unlock Deck
k this deck
31
Refer to the following figure when answering the following questions.
Figure 12.3: Yield Curves December 4, 2006 and 2012
Consider the yield curves in Figure 12.3. The curve for 12/4/2006 is unusual because:
A) it has no relationship to the real economy.
B) its short-term interest rates are higher than long-term interest rates.
C) it is inverted.
D) it is higher than the yield curve for 2012.
E) It is not unusual.
Unlock Deck
Unlock for access to all 135 flashcards in this deck.
Unlock Deck
k this deck
32
Firms alter their prices based on:
A) expected inflation.
B) expected inflation and supply conditions.
C) expected inflation and demand conditions.
D) demand conditions.
E) the previous period's aggregate supply.
A) expected inflation.
B) expected inflation and supply conditions.
C) expected inflation and demand conditions.
D) demand conditions.
E) the previous period's aggregate supply.
Unlock Deck
Unlock for access to all 135 flashcards in this deck.
Unlock Deck
k this deck
33
Refer to the following figure when answering the following questions.
Figure 12.2: IS-MP Curve
Consider Figure 12.2. If the stock market drops sharply, there is a loss in consumer and investor confidence and the economy moves from point ________. To prevent a ________, the Fed ________, and the economy moves from point ________.
A) a to d; recession; lowers interest rates; d to b
B) d to c; recession; lowers interest rates; c to b
C) c to b; bubble; raises interest rates; b to c
D) a to d; recession; lowers interest rates; d to c
E) Not enough information is given.
Unlock Deck
Unlock for access to all 135 flashcards in this deck.
Unlock Deck
k this deck
34
Refer to the following figure when answering the following questions.
Figure 12.2: IS-MP Curve
Consider Figure 12.2. If the Fed lowers interest rates and there are no aggregate demand shocks, the economy moves from point ________ to ________.
A) d; a
B) c; a
C) a; b
D) d; c
E) None of these answers is correct.
Figure 12.2: IS-MP Curve
Consider Figure 12.2. If the Fed lowers interest rates and there are no aggregate demand shocks, the economy moves from point ________ to ________.
A) d; a
B) c; a
C) a; b
D) d; c
E) None of these answers is correct.
Unlock Deck
Unlock for access to all 135 flashcards in this deck.
Unlock Deck
k this deck
35
The economywide rate of inflation is given by:
A) .
B) .
C) .
D) .
E) .
A)
.B)
.C)
.D)
.E)
. Unlock Deck
Unlock for access to all 135 flashcards in this deck.
Unlock Deck
k this deck
36
The Phillips curve assumes that inflation expectations are:
A) rational.
B) adaptive.
C) always wrong.
D) equal to zero.
E) None of these answers is correct.
A) rational.
B) adaptive.
C) always wrong.
D) equal to zero.
E) None of these answers is correct.
Unlock Deck
Unlock for access to all 135 flashcards in this deck.
Unlock Deck
k this deck
37
According to the Phillips curve, if current output equals potential output:
A) unemployment is zero.
B) inflation fluctuates a lot.
C) inflation is steady.
D) unemployment is negative.
E) the economy is booming.
A) unemployment is zero.
B) inflation fluctuates a lot.
C) inflation is steady.
D) unemployment is negative.
E) the economy is booming.
Unlock Deck
Unlock for access to all 135 flashcards in this deck.
Unlock Deck
k this deck
38
Refer to the following figure when answering the following questions.
Figure 12.2: IS-MP Curve
Consider Figure 12.2. If housing prices drop sharply, there is a loss in consumer and investor confidence and the economy moves from point ________. To prevent a ________, the Fed ________, and the economy moves from point ________.
A) a to d; recession; lowers interest rates; d to b
B) a to d; recession; lowers interest rates; d to c
C) c to b; bubble; raises interest rates; b to c
D) d to c; recession; lowers interest rates; c to b
E) Not enough information is given.
Unlock Deck
Unlock for access to all 135 flashcards in this deck.
Unlock Deck
k this deck
39
Economists who study monetary policy believe that it takes anywhere from ________ for monetary policy to have a substantial effect on economic activity.
A) 3 to 6 weeks
B) 6 to 18 days
C) 6 to 18 months
D) 3 to 6 months
E) 6 to 18 weeks
A) 3 to 6 weeks
B) 6 to 18 days
C) 6 to 18 months
D) 3 to 6 months
E) 6 to 18 weeks
Unlock Deck
Unlock for access to all 135 flashcards in this deck.
Unlock Deck
k this deck
40
Normally, yields on short-term Treasury bonds are ________ long-term Treasury bond yields.
A) equal to the fed funds rate minus
B) equal to inflation plus
C) the same as
D) higher than
E) lower than
A) equal to the fed funds rate minus
B) equal to inflation plus
C) the same as
D) higher than
E) lower than
Unlock Deck
Unlock for access to all 135 flashcards in this deck.
Unlock Deck
k this deck
41
According to the Phillips curve, if current output is above potential output:
A) inflation falls.
B) inflation rises.
C) unemployment falls.
D) inflation is constant.
E) tax rates rise.
A) inflation falls.
B) inflation rises.
C) unemployment falls.
D) inflation is constant.
E) tax rates rise.
Unlock Deck
Unlock for access to all 135 flashcards in this deck.
Unlock Deck
k this deck
42
Oil prices are closely watched because:
A) they hurt automobile owners.
B) they affect inflation directly.
C) of their impact on stock markets.
D) of their immediate impact on subsidies and taxes.
E) they affect inflation both directly and indirectly.
A) they hurt automobile owners.
B) they affect inflation directly.
C) of their impact on stock markets.
D) of their immediate impact on subsidies and taxes.
E) they affect inflation both directly and indirectly.
Unlock Deck
Unlock for access to all 135 flashcards in this deck.
Unlock Deck
k this deck
43
An increase in the interest rate by the Federal Reserve will affect only real interest rates because:
A) inflation is sticky in the short run.
B) of the quantity theory of money.
C) prices are flexible in the short and long runs.
D) contracts apply only in the very short run.
E) we are in the long run.
A) inflation is sticky in the short run.
B) of the quantity theory of money.
C) prices are flexible in the short and long runs.
D) contracts apply only in the very short run.
E) we are in the long run.
Unlock Deck
Unlock for access to all 135 flashcards in this deck.
Unlock Deck
k this deck
44
In the Phillips curve, the term ________ reflects ________.
A) ; cost-push inflation
B) ; cost-push inflation
C) ; the "true" rate of inflation
D) ; demand-pull inflation
E) ; the responsiveness of inflation to cost shocks
A)
; cost-push inflationB)
; cost-push inflationC)
; the "true" rate of inflationD)
; demand-pull inflationE)
; the responsiveness of inflation to cost shocks Unlock Deck
Unlock for access to all 135 flashcards in this deck.
Unlock Deck
k this deck
45
Figure 12.6: IS-MP Curve
Start from any equilibrium in Figure 12.6 to answer the following question. In 1980, U.S. inflation hit about 14 percent; Federal Reserve chairman ________ engineered a decline in inflation by ________ rates, shown in the figure as movement from point ________.
A) Volcker; raising inflation; b to c
B) Bernanke; raising interest; b to d
C) Volcker; lowering interest; c to b
D) Volcker; raising interest; b to c
E) Greenspan; lowering interest; a to b
Unlock Deck
Unlock for access to all 135 flashcards in this deck.
Unlock Deck
k this deck
46
In the Phillips curve measures:
A) a price shock.
B) how sensitive inflation is to interest rates.
C) how sensitive inflation is to aggregate demand conditions.
D) how sensitive inflation is to aggregate supply conditions.
E) how sensitive inflation is to price shocks.
measures:A) a price shock.
B) how sensitive inflation is to interest rates.
C) how sensitive inflation is to aggregate demand conditions.
D) how sensitive inflation is to aggregate supply conditions.
E) how sensitive inflation is to price shocks.
Unlock Deck
Unlock for access to all 135 flashcards in this deck.
Unlock Deck
k this deck
47
With adaptive expectations, the Phillips curve can be written as:
A) .
B) .
C) .
D) .
E) .
A)
.B)
.C)
.D)
.E)
. Unlock Deck
Unlock for access to all 135 flashcards in this deck.
Unlock Deck
k this deck
48
In the Phillips curve is:
A) a demand shock.
B) an inflation shock.
C) a measure of the sensitivity of inflation to demand conditions.
D) a permanent price trend.
E) fiscal policy shock.
is:A) a demand shock.
B) an inflation shock.
C) a measure of the sensitivity of inflation to demand conditions.
D) a permanent price trend.
E) fiscal policy shock.
Unlock Deck
Unlock for access to all 135 flashcards in this deck.
Unlock Deck
k this deck
49
Refer to the following figure when answering the following questions.
Figure 12.4: Phillips Curve
Consider the Phillips curve in Figure 12.4. At point a, the economy is ________; at point c, the economy is ________.
A) in recession; booming
B) in recession; in recession
C) in recession; in its long-run equilibrium
D) booming; in recession
E) in its long-run equilibrium; in recession
Unlock Deck
Unlock for access to all 135 flashcards in this deck.
Unlock Deck
k this deck
50
According to the Phillips curve, if the:
A) inflation rate is falling, the economy is booming.
B) inflation rate is rising, the economy is in recession.
C) inflation rate is rising, the economy is booming.
D) unemployment rate is falling, the economy is booming.
E) None of these answers is correct.
A) inflation rate is falling, the economy is booming.
B) inflation rate is rising, the economy is in recession.
C) inflation rate is rising, the economy is booming.
D) unemployment rate is falling, the economy is booming.
E) None of these answers is correct.
Unlock Deck
Unlock for access to all 135 flashcards in this deck.
Unlock Deck
k this deck
51
Recent energy legislation that dictates increased use of ethanol as automobile fuel might ________ overall inflation because corn prices will ________, affecting all downstream industries that use corn as a(n) ________.
A) decrease; rise; final good
B) increase; rise; input
C) not change; stay constant; final good
D) increase; rise; final good
E) Not enough information is given.
A) decrease; rise; final good
B) increase; rise; input
C) not change; stay constant; final good
D) increase; rise; final good
E) Not enough information is given.
Unlock Deck
Unlock for access to all 135 flashcards in this deck.
Unlock Deck
k this deck
52
In the Phillips curve is a:
A) temporary demand shock.
B) permanent price change.
C) temporary cost shock.
D) temporary unemployment shock.
E) structural macroeconomic change.
is a:A) temporary demand shock.
B) permanent price change.
C) temporary cost shock.
D) temporary unemployment shock.
E) structural macroeconomic change.
Unlock Deck
Unlock for access to all 135 flashcards in this deck.
Unlock Deck
k this deck
53
In the Phillips curve, , if
Is large, then:
A) price-setting behavior is completely insensitive to short-run fluctuations.
B) price-setting behavior is very insensitive to short-run fluctuations.
C) inflation is not very sensitive to short-run fluctuations.
D) price-setting behavior is very sensitive to short-run fluctuations.
E) Not enough information is given.
, if Is large, then:
A) price-setting behavior is completely insensitive to short-run fluctuations.
B) price-setting behavior is very insensitive to short-run fluctuations.
C) inflation is not very sensitive to short-run fluctuations.
D) price-setting behavior is very sensitive to short-run fluctuations.
E) Not enough information is given.
Unlock Deck
Unlock for access to all 135 flashcards in this deck.
Unlock Deck
k this deck
54
Based on the reasoning of the original version of the Phillips curve, conventional wisdom of the 1960s was that:
A) money is not neutral.
B) there is a strong positive relationship between unemployment and inflation.
C) there is no relationship between economic growth and the savings rate.
D) there is a permanent trade-off between inflation and economic performance.
E) the real interest rate is always equal to 2 percent.
Unlock Deck
Unlock for access to all 135 flashcards in this deck.
Unlock Deck
k this deck
55
According to reasoning by Milton Friedman and Edmund Phelps:
A) economic stimulus programs were destined to fail in the long run.
B) economic stimulus programs were destined to fail in the short and long runs.
C) unemployment does not react to fluctuations in output.
D) there is a theoretical maximum level of potential output that can be produced.
E) firms do not react to real interest rate changes.
Unlock Deck
Unlock for access to all 135 flashcards in this deck.
Unlock Deck
k this deck
56
Refer to the following figure when answering the following questions.
Figure 12.4: Phillips Curve
Consider the Phillips curve in Figure 12.4. At point b, the economy is ________, and at point a, the economy is ________.
A) in recession; booming
B) in recession; in its long-run equilibrium
C) in recession; in recession
D) booming; in recession
E) in its long-run equilibrium; in recession
Unlock Deck
Unlock for access to all 135 flashcards in this deck.
Unlock Deck
k this deck
57
According to the quantity theory of money, an increase in GDP ________ inflation, and the Phillips curve demonstrates that inflation ________ with rising GDP. This is because the quantity theory is a ________ theory of price behavior.
A) reduces; increases; long-run
B) raises; decreases; short-run
C) has zero influence on; decreases; money-neutral
D) raises; increases; short-run
E) reduces; does not move; Keynesian
A) reduces; increases; long-run
B) raises; decreases; short-run
C) has zero influence on; decreases; money-neutral
D) raises; increases; short-run
E) reduces; does not move; Keynesian
Unlock Deck
Unlock for access to all 135 flashcards in this deck.
Unlock Deck
k this deck
58
In the Phillips curve, the term ________ reflects ________.
A) demand-pull inflation
B) ; cost-push inflation
C) ; the "true" rate of inflation
D) ; demand-pull inflation
E) the responsiveness of inflation to cost shocks
A)
demand-pull inflationB)
; cost-push inflationC)
; the "true" rate of inflationD)
; demand-pull inflationE)
the responsiveness of inflation to cost shocks Unlock Deck
Unlock for access to all 135 flashcards in this deck.
Unlock Deck
k this deck
59
Which of the following contributed to high levels of inflation in the 1970s?
i. Oil price shocks
ii. Lower taxes
iii. A productivity slowdown
A) i only
B) ii only
C) iii only
D) i and iii
E) ii and iii
i. Oil price shocks
ii. Lower taxes
iii. A productivity slowdown
A) i only
B) ii only
C) iii only
D) i and iii
E) ii and iii
Unlock Deck
Unlock for access to all 135 flashcards in this deck.
Unlock Deck
k this deck
60
The most immediate and visible form of inflation shock is:
A) the real wage.
B) the price of corn.
C) the price of oil.
D) growth in the stock market.
E) bond prices.
A) the real wage.
B) the price of corn.
C) the price of oil.
D) growth in the stock market.
E) bond prices.
Unlock Deck
Unlock for access to all 135 flashcards in this deck.
Unlock Deck
k this deck
61
Figure 12.8: Output
Consider Figure 12.8. You are chairman of the Federal Reserve in 1995. You believe potential output follows the dotted line after 1993, but in actuality, it follows the line denoted "True potential output." The current state of the economy is given by the curve "Actual output." Given the information in the figure, you ________, because you believe the economy is in a ________, but your advice instead ________.
A) lower interest rates; recession; accelerates inflation
B) raise interest rates; boom; accelerates a recession
C) keep interest rates the same; boom; accelerates inflation
D) lower interest rates; boom; increases unemployment
E) Not enough information is given.
Unlock Deck
Unlock for access to all 135 flashcards in this deck.
Unlock Deck
k this deck
62
The "jobless recovery" in the aftermath of the 2001 recession was an apparent violation of:
A) Okun's law.
B) the Phillips curve.
C) the quantity theory.
D) the neoclassical model.
E) moral hazard.
A) Okun's law.
B) the Phillips curve.
C) the quantity theory.
D) the neoclassical model.
E) moral hazard.
Unlock Deck
Unlock for access to all 135 flashcards in this deck.
Unlock Deck
k this deck
63
Refer to the following figure when answering the following questions.
Figure 12.9: Change in Inflation by Quarter
Consider Figure 12.9. You are Federal Reserve chairman Greenspan and today's date is the second quarter of 1997 (1997.2). Given the information you have, using the Phillips curve, to stabilize the economy you would ________ interest rates, risking ________.
A) raise; recession
B) raise; inflation
C) lower; inflation
D) lower; higher unemployment
E) Not enough information is given.
Unlock Deck
Unlock for access to all 135 flashcards in this deck.
Unlock Deck
k this deck
64
Which of the following contributed to high levels of inflation in the 1970s?
i. A Soviet invasion of Afghanistan
ii. Loose monetary policy
iii. A productivity slowdown
A) i only
B) ii only
C) iii only
D) i and iii
E) ii and iii
i. A Soviet invasion of Afghanistan
ii. Loose monetary policy
iii. A productivity slowdown
A) i only
B) ii only
C) iii only
D) i and iii
E) ii and iii
Unlock Deck
Unlock for access to all 135 flashcards in this deck.
Unlock Deck
k this deck
65
If nominal interest rates are high, you:
A) hold only cash.
B) hold less savings and more cash.
C) hold all your money in a different currency.
D) never have any cash in your checking account.
E) hold less cash and more savings.
A) hold only cash.
B) hold less savings and more cash.
C) hold all your money in a different currency.
D) never have any cash in your checking account.
E) hold less cash and more savings.
Unlock Deck
Unlock for access to all 135 flashcards in this deck.
Unlock Deck
k this deck
66
Which of the following scenarios best describes the short-run model?
A)
B)
C)
D)
E) None of these answers is correct.
A)
B)
C)
D)
E) None of these answers is correct.
Unlock Deck
Unlock for access to all 135 flashcards in this deck.
Unlock Deck
k this deck
67
Refer to the following figure when answering the following questions.
Figure 12.9: Change in Inflation by Quarter
Consider Figure 12.9. You are Federal Reserve chairman Greenspan and today's date is the first quarter of 1999 (1999.1). Given the information you have, using the Phillips curve, to stabilize the economy you would ________ interest rates, risking ________.
A) raise; inflation
B) raise; recession
C) lower; recession
D) lower; higher unemployment
E) Not enough information is given.
Unlock Deck
Unlock for access to all 135 flashcards in this deck.
Unlock Deck
k this deck
68
One of the remarkable things about the 2001 recession was the:
A) fact that unemployment fell.
B) jobless recovery.
C) rapid return to potential output.
D) deflation.
E) impact of Hurricane Katrina on it.
A) fact that unemployment fell.
B) jobless recovery.
C) rapid return to potential output.
D) deflation.
E) impact of Hurricane Katrina on it.
Unlock Deck
Unlock for access to all 135 flashcards in this deck.
Unlock Deck
k this deck
69
Refer to the following figure when answering the following questions.
Figure 12.11: Change in Inflation by Month
Consider Figure 12.11. You are Federal Reserve chairman Volcker and today's date is the first quarter of 1980 (1980.1). You suggest the appropriate policy would be to ________. In the second quarter of 1981, you consider your performance, and you conclude that you ________; using the Phillips curve, you see the country is now ________.
A) lower taxes; failed to tame inflation; in debt
B) lower interest rates; failed at taming inflation; in a recession
C) raise interest rates; succeeded in taming the recession; booming
D) raise interest rates; succeeded in taming inflation; in a recession
E) raise taxes; succeeded in taming inflation; in debt
Unlock Deck
Unlock for access to all 135 flashcards in this deck.
Unlock Deck
k this deck
70
Which of the following statements is NOT true?
A) Small menu prices lead to price stickiness.
B) In the classical dichotomy, some prices are sticky.
C) In the classical dichotomy, an increase in money supply growth leads to a corresponding increase in inflation.
D) Short-run contracts lead to price persistence.
E) Imperfect information may lead to price inflexibility.
Unlock Deck
Unlock for access to all 135 flashcards in this deck.
Unlock Deck
k this deck
71
As lender in the last resort, the Fed loans money to banks at:
A) the federal funds rate.
B) the three-month T-bill interest rate.
C) the prime interest rate.
D) LIBOR.
E) the discount rate.
A) the federal funds rate.
B) the three-month T-bill interest rate.
C) the prime interest rate.
D) LIBOR.
E) the discount rate.
Unlock Deck
Unlock for access to all 135 flashcards in this deck.
Unlock Deck
k this deck
72
Figure 12.7: Output
Consider Figure 12.7. You are chairman of the Federal Reserve in 1975. You believe potential output follows the dotted line after 1973, but in actuality, it follows the line denoted "True potential output." The current state of the economy is given by the curve "Actual output." Given the information in the figure, you ________, because you believe the economy is in a ________, but your advice instead ________.
A) lower interest rates; recession; accelerates inflation
B) raise interest rates; recession; accelerates inflation
C) keep interest rates the same; boom; accelerates inflation
D) lower interest rates; boom; increases unemployment
E) Not enough information is given.
Unlock Deck
Unlock for access to all 135 flashcards in this deck.
Unlock Deck
k this deck
73
The money demand curve:
A) slopes downward with respect to the discount rate.
B) slopes downward with respect to the nominal interest rate.
C) slopes upward with respect to the nominal interest rate.
D) always is flat with respect to the nominal interest rate.
E) is flat with respect to the inflation rate.
A) slopes downward with respect to the discount rate.
B) slopes downward with respect to the nominal interest rate.
C) slopes upward with respect to the nominal interest rate.
D) always is flat with respect to the nominal interest rate.
E) is flat with respect to the inflation rate.
Unlock Deck
Unlock for access to all 135 flashcards in this deck.
Unlock Deck
k this deck
74
Refer to the following figure when answering the following questions.
Figure 12.10: Output Gap: 1990-2000
-Consider Figure 12.10, which shows the output gap from 1990 to 2000, by quarter. If this is all the information you have, during the period 1997.1-1999.4, from the Phillips curve, you would conclude that:
A) inflation is accelerating, 0.
B) inflation is decelerating, 0.
C) unemployment is falling.
D) unemployment is rising.
E) Not enough information is given.
Figure 12.10: Output Gap: 1990-2000
-Consider Figure 12.10, which shows the output gap
from 1990 to 2000, by quarter. If this is all the information you have, during the period 1997.1-1999.4, from the Phillips curve, you would conclude that:A) inflation is accelerating, 0.
B) inflation is decelerating, 0.
C) unemployment is falling.
D) unemployment is rising.
E) Not enough information is given.
Unlock Deck
Unlock for access to all 135 flashcards in this deck.
Unlock Deck
k this deck
75
Refer to the following figure when answering the following questions.
Figure 12.10: Output Gap: 1990-2000
-Consider Figure 12.10, which shows the output gap from 1990 to 2000, by quarter. If this is all the information you have, during the period 1993.1-1993.4, from the Phillips curve, you would conclude that:
A) inflation is decelerating, 0.
B) inflation is accelerating, 0.
C) unemployment is falling.
D) unemployment is rising.
E) Not enough information is given.
Figure 12.10: Output Gap: 1990-2000
-Consider Figure 12.10, which shows the output gap
from 1990 to 2000, by quarter. If this is all the information you have, during the period 1993.1-1993.4, from the Phillips curve, you would conclude that:A) inflation is decelerating, 0.
B) inflation is accelerating, 0.
C) unemployment is falling.
D) unemployment is rising.
E) Not enough information is given.
Unlock Deck
Unlock for access to all 135 flashcards in this deck.
Unlock Deck
k this deck
76
Which of the following scenarios best describes the short-run model?
A)
B)
C)
D)
E) None of these answers is correct.
A)
B)
C)
D)
E) None of these answers is correct.
Unlock Deck
Unlock for access to all 135 flashcards in this deck.
Unlock Deck
k this deck
77
The nominal interest rate:
A) is set by Congress.
B) is equal to the rate of inflation.
C) always is equal to the 10-year bond rate of return.
D) is the opportunity cost of holding money.
E) is constant.
A) is set by Congress.
B) is equal to the rate of inflation.
C) always is equal to the 10-year bond rate of return.
D) is the opportunity cost of holding money.
E) is constant.
Unlock Deck
Unlock for access to all 135 flashcards in this deck.
Unlock Deck
k this deck
78
Refer to the following figure when answering the following questions.
Figure 12.11: Change in Inflation by Month
Consider Figure 12.11. You are Federal Reserve chairman Volcker and today's date is mid-1977. You suggest the appropriate policy would be to ________. You reevaluate your policy in mid-1979 and conclude that you ________; using the Phillips curve, you see the country is now in ________.
A) lower taxes; failed to tame inflation; debt
B) lower interest rates; failed at taming inflation; a recession
C) raise interest rates; failed at taming inflation; expansion
D) raise interest rates; succeeded in taming inflation; a recession
E) raise taxes; succeeded in taming inflation; debt
Unlock Deck
Unlock for access to all 135 flashcards in this deck.
Unlock Deck
k this deck
79
Refer to the following figure when answering the following questions.
Figure 12.9: Change in Inflation by Quarter
Consider Figure 12.9. You are Federal Reserve chairman Greenspan and today's date is the fourth quarter of 1997 (1997.4). Given the information you have, using the Phillips curve, to stabilize the economy you would ________ interest rates, risking ________.
A) raise; inflation
B) lower; inflation
C) raise; recession
D) lower; higher unemployment
E) Not enough information is given.
Unlock Deck
Unlock for access to all 135 flashcards in this deck.
Unlock Deck
k this deck
80
Which of the following statements is NOT true?
A) Many agents suffer from money illusion.
B) Small menu prices lead to price stickiness.
C) Under adaptive expectations, prices are perfectly flexible.
D) In the classical dichotomy, all prices are flexible.
E) Imperfect competition may lead to price inflexibility.
A) Many agents suffer from money illusion.
B) Small menu prices lead to price stickiness.
C) Under adaptive expectations, prices are perfectly flexible.
D) In the classical dichotomy, all prices are flexible.
E) Imperfect competition may lead to price inflexibility.
Unlock Deck
Unlock for access to all 135 flashcards in this deck.
Unlock Deck
k this deck
Unlock Deck
Unlock for access to all 135 flashcards in this deck.


