Exam 12: Monetary Policy and the Phillips Curve
Exam 1: Introduction to Macroeconomics35 Questions
Exam 2: Measuring the Macroeconomy114 Questions
Exam 3: An Overview of Long-Run Economic Growth110 Questions
Exam 4: A Model of Production129 Questions
Exam 5: The Solow Growth Model126 Questions
Exam 6: Growth and Ideas120 Questions
Exam 7: The Labor Market, Wages, and Unemployment119 Questions
Exam 8: Inflation117 Questions
Exam 9: An Introduction to the Short Run113 Questions
Exam 10: The Great Recession: a First Look108 Questions
Exam 11: The Is Curve128 Questions
Exam 12: Monetary Policy and the Phillips Curve135 Questions
Exam 13: Stabilization Policy and the Asad Framework113 Questions
Exam 14: The Great Recession and the Short-Run Model112 Questions
Exam 15: Dsge Models: the Frontier of Business Cycle Research119 Questions
Exam 16: Consumption109 Questions
Exam 17: Investment116 Questions
Exam 18: The Government and the Macroeconomy122 Questions
Exam 19: International Trade107 Questions
Exam 20: Exchange Rates and International Finance142 Questions
Exam 21: Parting Thoughts35 Questions
Select questions type
Refer to the following figure when answering the following questions.
Figure 12.4: Phillips Curve 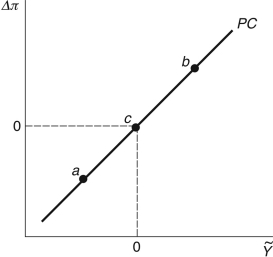 -Consider the Phillips curve in Figure 12.4. At point a, the economy is ________; at point c, the economy is ________.
Free
(Multiple Choice)
5.0/5  (30)
(30)
Correct Answer: Verified
C
An implication of sticky inflation is that, through monetary policy changes, the Federal Reserve (the Fed):
Free
(Multiple Choice)
4.8/5 (39)
Correct Answer:Verified
C
Monetary economists find that it takes anywhere from six to eight weeks for monetary policy to have a substantial impact on economic activity.
Free
(True/False)
4.8/5 (37)
Correct Answer:Verified
False
An increase in the interest rate by the Federal Reserve will affect only real interest rates because:
(Multiple Choice)
4.7/5 (27)
Refer to the following figure when answering the following questions.
Figure 12.4: Phillips Curve
-Consider the Phillips curve in Figure 12.4. At point b, the economy is ________, and at point a, the economy is ________.
(Multiple Choice)
4.9/5 (33)
Which of the following is the mission of the Federal Reserve Bank?
i. Preserve price stability
ii. Foster economic growth and employment
iii. Promote a stable financial system
(Multiple Choice)
4.9/5 (34)
When the Federal Reserve wants to increase the money supply, it:
(Multiple Choice)
4.8/5 (32)
Refer to the following figure when answering the following questions.
Figure 12.9: Change in Inflation by Quarter 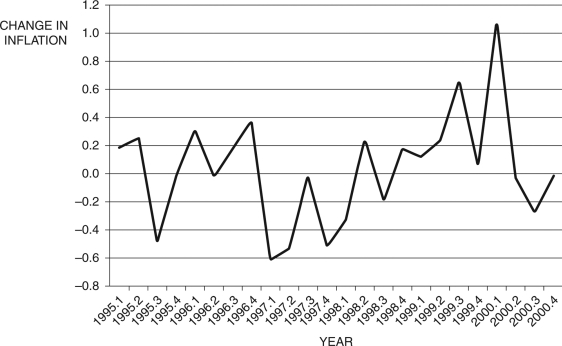 -Consider Figure 12.9. You are Federal Reserve chairman Greenspan and today's date is the fourth quarter of 1997 (1997.4). Given the information you have, using the Phillips curve, to stabilize the economy you would ________ interest rates, risking ________.
(Multiple Choice)
4.8/5 (35)
When economists say "sticky inflation," they mean that inflation does not react directly with the monetary policy.
(True/False)
4.8/5 (29)
When the Fed targets the interest rate, it adjusts the money supply to maintain that interest-rate target.
(True/False)
4.9/5 (42)
Once a ________ is chosen, the main tool the Federal Reserve uses to change the money supply is ________.
(Multiple Choice)
4.8/5 (37)
Figure 12.7: Output 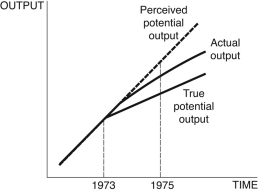 -Consider Figure 12.7. You are chairman of the Federal Reserve in 1975. You believe potential output follows the dotted line after 1973, but in actuality, it follows the line denoted "True potential output." The current state of the economy is given by the curve "Actual output." Given the information in the figure, you ________, because you believe the economy is in a ________, but your advice instead ________.
(Multiple Choice)
4.8/5 (31)
Refer to the following figure when answering the following questions.
Figure 12.9: Change in Inflation by Quarter
-Consider Figure 12.9. You are Federal Reserve chairman Greenspan and today's date is the first quarter of 1999 (1999.1). Given the information you have, using the Phillips curve, to stabilize the economy you would ________ interest rates, risking ________.
(Multiple Choice)
4.9/5 (36)
The interest rate that the Fed charges to banks to borrow is the federal funds rate.
(True/False)
4.9/5 (36)
One of the explanations for the high rates of inflation in the 1970s is a productivity slowdown.
(True/False)
5.0/5 (33)
If the central bank is targeting the money supply, the money supply is ________ and ________ with respect to the nominal interest rate.
(Multiple Choice)
4.8/5 (29)
Filters
- Essay(0)
- Multiple Choice(0)
- Short Answer(0)
- True False(0)
- Matching(0)