Deck 7: The Labor Market, Wages, and Unemployment
Full screen (f)
Question
Refer to the following table to answer the following questions.
Table 7.1: U.S. Employment Status (in thousands)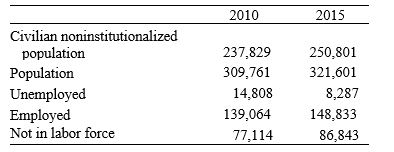
Consider Table 7.1. In 2015, the employment-population ratio was ________ percent.
A) 5.3
B) 59.3
C) 94.7
D) 48.9
E) 61.0
Table 7.1: U.S. Employment Status (in thousands)
Consider Table 7.1. In 2015, the employment-population ratio was ________ percent.
A) 5.3
B) 59.3
C) 94.7
D) 48.9
E) 61.0
Question
Refer to the following figure to answer the following questions.
Figure 7.1: U.S. Unemployment Rate: 1975-2015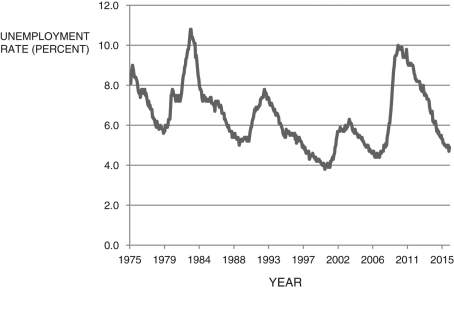 (Source: U.S. Bureau of Labor Statistics)
Given the unemployment rate data depicted in Figure 7.1, the year of the peak of the boom was:
A) 1993.
B) 2001.
C) 1983.
D) 2010.
E) 1992.
Figure 7.1: U.S. Unemployment Rate: 1975-2015
(Source: U.S. Bureau of Labor Statistics)Given the unemployment rate data depicted in Figure 7.1, the year of the peak of the boom was:
A) 1993.
B) 2001.
C) 1983.
D) 2010.
E) 1992.
Question
Question
Refer to the following figure to answer the following questions.
Figure 7.1: U.S. Unemployment Rate: 1975-2015 (Source: U.S. Bureau of Labor Statistics)
Using Figure 7.1, Which of the following year(s) are the approximate trough of a recession?
A) 1980
B) 1989
C) 2001
D) 2010
E) All of these answers are correct.
Figure 7.1: U.S. Unemployment Rate: 1975-2015
(Source: U.S. Bureau of Labor Statistics)Using Figure 7.1, Which of the following year(s) are the approximate trough of a recession?
A) 1980
B) 1989
C) 2001
D) 2010
E) All of these answers are correct.
Question
Question
Refer to the following table to answer the following questions.
Table 7.1: U.S. Employment Status (in thousands)
Consider Table 7.1. In 2010, the unemployment rate was ________ percent.
A) 50.1
B) 9.6
C) 39.8
D) 6.2
E) 10.6
Table 7.1: U.S. Employment Status (in thousands)
Consider Table 7.1. In 2010, the unemployment rate was ________ percent.
A) 50.1
B) 9.6
C) 39.8
D) 6.2
E) 10.6
Question
Refer to the following figure when answering the following questions.
Figure 7.2: United Kingdom Unemployment Rate: 1971-2015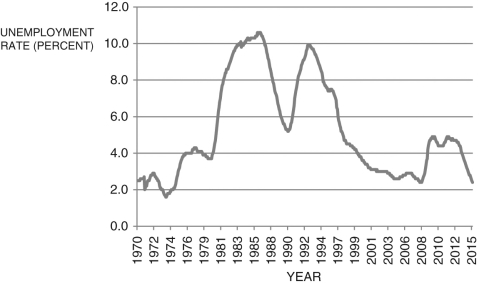 (Source: OECD and Federal Reserve Economic Data, Federal Reserve Bank of St. Louis)
Given the U.K. unemployment rate data depicted in Figure 7.2, the approximate year of the peak of the boom was:
A) 1989.
B) 1986.
C) 1992.
D) 2009.
E) 1972.
Figure 7.2: United Kingdom Unemployment Rate: 1971-2015
(Source: OECD and Federal Reserve Economic Data, Federal Reserve Bank of St. Louis)Given the U.K. unemployment rate data depicted in Figure 7.2, the approximate year of the peak of the boom was:
A) 1989.
B) 1986.
C) 1992.
D) 2009.
E) 1972.
Question
Question
Question
Refer to the following table to answer the following questions.
Table 7.1: U.S. Employment Status (in thousands)
Consider Table 7.1. Between 2010 and 2015, the employment-population ratio ________ to/at ________.
A) fell; 58.5 percent
B) rose; 90.4 percent
C) stayed more or less the same; 37.9 percent
D) fell; 5.3 percent
E) rose; 59.3 percent
Table 7.1: U.S. Employment Status (in thousands)
Consider Table 7.1. Between 2010 and 2015, the employment-population ratio ________ to/at ________.
A) fell; 58.5 percent
B) rose; 90.4 percent
C) stayed more or less the same; 37.9 percent
D) fell; 5.3 percent
E) rose; 59.3 percent
Question
Question
Refer to the following table to answer the following questions.
Table 7.1: U.S. Employment Status (in thousands)
Consider Table 7.1. Between 2010 and 2015, the unemployment rate ________ and the employment-population ratio ________ (rounded to 1 decimal point).
A) rose; fell
B) rose; rose
C) fell; rose
D) fell; fell
E) Not enough information is given.
Table 7.1: U.S. Employment Status (in thousands)
Consider Table 7.1. Between 2010 and 2015, the unemployment rate ________ and the employment-population ratio ________ (rounded to 1 decimal point).
A) rose; fell
B) rose; rose
C) fell; rose
D) fell; fell
E) Not enough information is given.
Question
Refer to the following table to answer the following questions.
Table 7.1: U.S. Employment Status (in thousands)
Consider Table 7.1. In 2015, the unemployment rate was ________ percent.
A) 39.0
B) 3.3
C) 5.6
D) 58.3
E) 5.3
Table 7.1: U.S. Employment Status (in thousands)
Consider Table 7.1. In 2015, the unemployment rate was ________ percent.
A) 39.0
B) 3.3
C) 5.6
D) 58.3
E) 5.3
Question
Question
Refer to the following figure to answer the following questions.
Figure 7.1: U.S. Unemployment Rate: 1975-2015 (Source: U.S. Bureau of Labor Statistics)
Using Figure 7.1, The approximate year of the peak of the boom was:
A) 1982.
B) 1992.
C) 2005.
D) 2010.
E) 1990.
Figure 7.1: U.S. Unemployment Rate: 1975-2015
(Source: U.S. Bureau of Labor Statistics)Using Figure 7.1, The approximate year of the peak of the boom was:
A) 1982.
B) 1992.
C) 2005.
D) 2010.
E) 1990.
Question
Refer to the following table to answer the following questions.
Table 7.1: U.S. Employment Status (in thousands)
Consider Table 7.1. In 2010, the employment-population ratio was ________ percent.
A) 64.7
B) 60.2
C) 9.6
D) 58.5
E) 90.4
Table 7.1: U.S. Employment Status (in thousands)
Consider Table 7.1. In 2010, the employment-population ratio was ________ percent.
A) 64.7
B) 60.2
C) 9.6
D) 58.5
E) 90.4
Question
Refer to the following figure to answer the following questions.
Figure 7.1: U.S. Unemployment Rate: 1975-2015 (Source: U.S. Bureau of Labor Statistics)
Using Figure 7.1, Which of the following year(s) are the approximate trough of a recession?
A) 2001
B) 1983
C) 1979
D) 2012
E) All of these answers are correct.
Figure 7.1: U.S. Unemployment Rate: 1975-2015
(Source: U.S. Bureau of Labor Statistics)Using Figure 7.1, Which of the following year(s) are the approximate trough of a recession?
A) 2001
B) 1983
C) 1979
D) 2012
E) All of these answers are correct.
Question
Refer to the following figure to answer the following questions.
Figure 7.1: U.S. Unemployment Rate: 1975-2015 (Source: U.S. Bureau of Labor Statistics)
Using Figure 7.1, Which of the following year(s) are the approximate trough of a recession?
A) 1975
B) 1983
C) 2011
D) All of these answers are correct.
E) None of these answers is correct.
Figure 7.1: U.S. Unemployment Rate: 1975-2015
(Source: U.S. Bureau of Labor Statistics)Using Figure 7.1, Which of the following year(s) are the approximate trough of a recession?
A) 1975
B) 1983
C) 2011
D) All of these answers are correct.
E) None of these answers is correct.
Question
Question
Question
In the labor market depicted in Figure 7.3, a decrease in labor regulation shifts labor:
A) supply from to
to  .
.
B) demand from to
to  .
.
C) demand from to
to  .
.
D) supply from to
to  .
.
E) None of these answers is correct.
A) supply from
to .B) demand from
to .C) demand from
to .D) supply from
to .E) None of these answers is correct.
Question
Question
Question
Question
Refer to the following figure when answering the following questions.
Figure 7.2: United Kingdom Unemployment Rate: 1971-2015 (Source: OECD and Federal Reserve Economic Data, Federal Reserve Bank of St. Louis)
Given the U.K. unemployment rate data depicted in Figure 7.2, the year of the trough of a recession was:
A) 1991.
B) 2006.
C) 1981.
D) 1973.
E) 1993.
Figure 7.2: United Kingdom Unemployment Rate: 1971-2015
(Source: OECD and Federal Reserve Economic Data, Federal Reserve Bank of St. Louis)Given the U.K. unemployment rate data depicted in Figure 7.2, the year of the trough of a recession was:
A) 1991.
B) 2006.
C) 1981.
D) 1973.
E) 1993.
Question
In the labor market depicted in Figure 7.3, an increase in oil prices:
A) shifts labor demand from to
to  .
.
B) shifts labor supply from to
to  .
.
C) shifts labor demand from to
to  .
.
D) produces no change in either the labor supply or demand curve.
E) None of these answers is correct.
A) shifts labor demand from
to .B) shifts labor supply from
to .C) shifts labor demand from
to .D) produces no change in either the labor supply or demand curve.
E) None of these answers is correct.
Question
In March 2016, the United States imposed tariffs on steel imports from China. Using the labor market depicted in Figure 7.3, this would have the impact on the steel labor market of shifting labor:
A) supply from to
to  .
.
B) demand from to
to  .
.
C) demand from to
to  .
.
D) supply from to
to  .
.
E) None of these answers is correct.
A) supply from
to .B) demand from
to .C) demand from
to .D) supply from
to .E) None of these answers is correct.
Question
Question
Question
Question
Question
Question
Question
In the labor market depicted in Figure 7.3, investment in new physical capital shifts labor:
A) supply from to
to  .
.
B) supply from to
to  .
.
C) demand from to
to  .
.
D) demand from to
to  .
.
E) None of these answers is correct.
A) supply from
to .B) supply from
to .C) demand from
to .D) demand from
to .E) None of these answers is correct.
Question
Question
Question
Refer to the following figure when answering the following questions.
Figure 7.3: Labor Market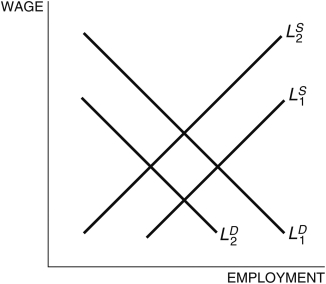
In the labor market depicted in Figure 7.3, an increase in the income tax would result in a shift in labor:
A) supply from to
to  .
.
B) demand from to
to  .
.
C) demand from to
to  .
.
D) supply from to
to  .
.
E) None of these answers is correct.
Figure 7.3: Labor Market
In the labor market depicted in Figure 7.3, an increase in the income tax would result in a shift in labor:
A) supply from
to .B) demand from
to .C) demand from
to .D) supply from
to .E) None of these answers is correct.
Question
Question
Question
In the labor market depicted in Figure 7.3, an increase in the income tax would result in:
A) a shift in labor supply from to
to  .
.
B) a shift in labor demand from to
to  .
.
C) a shift in labor demand from to
to  .
.
D) no change in either the labor supply or demand curve.
E) None of these answers is correct.
A) a shift in labor supply from
to .B) a shift in labor demand from
to .C) a shift in labor demand from
to .D) no change in either the labor supply or demand curve.
E) None of these answers is correct.
Question
Question
Refer to the following figure when answering the following questions.
Figure 7.4: Labor Market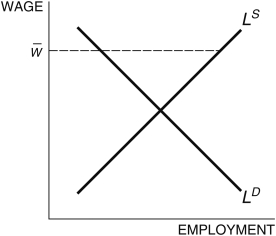
Consider the labor market depicted in Figure 7.4. The wage, fixed at , is called ________ and ________.
A) a wage rigidity; reduces unemployment
B) a wage rigidity; decreases labor market volatility
C) a flexible wage; increases labor market volatility
D) a wage rigidity; increases labor market volatility
E) the market wage; increases unemployment
Figure 7.4: Labor Market
Consider the labor market depicted in Figure 7.4. The wage, fixed at
, is called ________ and ________.A) a wage rigidity; reduces unemployment
B) a wage rigidity; decreases labor market volatility
C) a flexible wage; increases labor market volatility
D) a wage rigidity; increases labor market volatility
E) the market wage; increases unemployment
Question
Question
Question
Question
Question
Question
Question
Question
Refer to the following table 7.2 when answering the following questions. 
Consider the data in Table 7.2. Using the "bathtub model" of unemployment, in 2010 the natural rate of unemployment was ________ percent.
A) 94.6
B) 5.7
C) 5.4
D) 19.6
E) 8.6
Consider the data in Table 7.2. Using the "bathtub model" of unemployment, in 2010 the natural rate of unemployment was ________ percent.
A) 94.6
B) 5.7
C) 5.4
D) 19.6
E) 8.6
Question
Question
Question
Question
Question
Question
Question
Refer to the following figure when answering the following questions.
Figure 7.4: Labor Market
Consider the labor market depicted in Figure 7.4. If the market wage is fixed at , it is called ________ and it ________ unemployment.
A) a wage ceiling; does nothing to
B) a wage rigidity; increases
C) the market wage; does nothing to
D) the market wage; increases
E) a wage rigidity; decreases
Figure 7.4: Labor Market
Consider the labor market depicted in Figure 7.4. If the market wage is fixed at
, it is called ________ and it ________ unemployment.A) a wage ceiling; does nothing to
B) a wage rigidity; increases
C) the market wage; does nothing to
D) the market wage; increases
E) a wage rigidity; decreases
Question
Question
Question
Question
Question
Question
Question
Question
Question
Question
Question
Question
You win the lottery, which pays $1 million in 20 annual $50,000 payments. Your friends ask how much that would be if you received a single lump sum payment today. You do not have your calculator, but you show them which of the following equations to help them solve it themselves, assuming the interest rate is 10 percent?
A)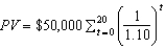
B)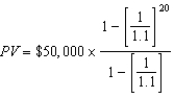
C) (50,000 * 20)/1.1
D)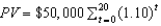
E) PV=$1,000,000/1.10
A)
B)
C) (50,000 * 20)/1.1
D)
E) PV=$1,000,000/1.10
Question
Question
In the "bathtub model " of unemployment, the key equation is:
A) .
.
B) .
.
C) .
.
D) .
.
E) .
.
A)
.B)
.C)
.D)
.E)
. Question
Refer to the following table 7.2 when answering the following questions.
Consider the data in Table 7.2. Using the "bathtub model" of unemployment, in 2015 the natural rate of unemployment was ________ percent.
A) 7.0
B) 7.5
C) 5.0
D) 93.0
E) 30.6
Consider the data in Table 7.2. Using the "bathtub model" of unemployment, in 2015 the natural rate of unemployment was ________ percent.
A) 7.0
B) 7.5
C) 5.0
D) 93.0
E) 30.6
Question
Question
Refer to the following table 7.2 when answering the following questions.
Consider the data in Table 7.2. In ________, the natural rate of unemployment was the higher of the two years at ________ percent.
A) 2015; 7.0
B) 2010; 94.6
C) 2010; 8.6
D) 2015; 7.5
E) 2015; 5.0
Consider the data in Table 7.2. In ________, the natural rate of unemployment was the higher of the two years at ________ percent.
A) 2015; 7.0
B) 2010; 94.6
C) 2010; 8.6
D) 2015; 7.5
E) 2015; 5.0
Question
Question
Question
The present discounted value equation, 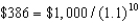 , means you:
A) would prefer to receive $386 today rather than $1,000 in 10 years.
B) are indifferent between receiving $386 today and $1,000 in 10 years.
C) would prefer to receive $1,000 in 10 years rather than $386 today.
D) are indifferent between receiving $386 today and $1,000 in 100 years.
E) Not enough information is given.
, means you:A) would prefer to receive $386 today rather than $1,000 in 10 years.
B) are indifferent between receiving $386 today and $1,000 in 10 years.
C) would prefer to receive $1,000 in 10 years rather than $386 today.
D) are indifferent between receiving $386 today and $1,000 in 100 years.
E) Not enough information is given.
Question
Question
Question

Unlock Deck
Sign up to unlock the cards in this deck!
Unlock Deck
Unlock Deck
1/119
Play
Full screen (f)
Deck 7: The Labor Market, Wages, and Unemployment
1
Refer to the following table to answer the following questions.
Table 7.1: U.S. Employment Status (in thousands)
Consider Table 7.1. In 2015, the employment-population ratio was ________ percent.
A) 5.3
B) 59.3
C) 94.7
D) 48.9
E) 61.0
Table 7.1: U.S. Employment Status (in thousands)
Consider Table 7.1. In 2015, the employment-population ratio was ________ percent.
A) 5.3
B) 59.3
C) 94.7
D) 48.9
E) 61.0
59.3
2
Refer to the following figure to answer the following questions.
Figure 7.1: U.S. Unemployment Rate: 1975-2015 (Source: U.S. Bureau of Labor Statistics)
Given the unemployment rate data depicted in Figure 7.1, the year of the peak of the boom was:
A) 1993.
B) 2001.
C) 1983.
D) 2010.
E) 1992.
Figure 7.1: U.S. Unemployment Rate: 1975-2015
(Source: U.S. Bureau of Labor Statistics)Given the unemployment rate data depicted in Figure 7.1, the year of the peak of the boom was:
A) 1993.
B) 2001.
C) 1983.
D) 2010.
E) 1992.
2001.
3
Generally, during a recession:
A) inflation rises.
B) the natural rate of unemployment rises.
C) the employment rate rises.
D) the unemployment rate rises.
E) there is no change in the unemployment rate.
A) inflation rises.
B) the natural rate of unemployment rises.
C) the employment rate rises.
D) the unemployment rate rises.
E) there is no change in the unemployment rate.
the unemployment rate rises.
4
Refer to the following figure to answer the following questions.
Figure 7.1: U.S. Unemployment Rate: 1975-2015 (Source: U.S. Bureau of Labor Statistics)
Using Figure 7.1, Which of the following year(s) are the approximate trough of a recession?
A) 1980
B) 1989
C) 2001
D) 2010
E) All of these answers are correct.
Figure 7.1: U.S. Unemployment Rate: 1975-2015
(Source: U.S. Bureau of Labor Statistics)Using Figure 7.1, Which of the following year(s) are the approximate trough of a recession?
A) 1980
B) 1989
C) 2001
D) 2010
E) All of these answers are correct.
Unlock Deck
Unlock for access to all 119 flashcards in this deck.
Unlock Deck
k this deck
5
Between 1960 and 2000, the:
A) employment-population ratio was always rising.
B) employment-population ratio generally was falling.
C) unemployment-population ratio generally was rising.
D) employment-population ratio generally was rising.
E) None of these answers is correct.
A) employment-population ratio was always rising.
B) employment-population ratio generally was falling.
C) unemployment-population ratio generally was rising.
D) employment-population ratio generally was rising.
E) None of these answers is correct.
Unlock Deck
Unlock for access to all 119 flashcards in this deck.
Unlock Deck
k this deck
6
Refer to the following table to answer the following questions.
Table 7.1: U.S. Employment Status (in thousands)
Consider Table 7.1. In 2010, the unemployment rate was ________ percent.
A) 50.1
B) 9.6
C) 39.8
D) 6.2
E) 10.6
Table 7.1: U.S. Employment Status (in thousands)
Consider Table 7.1. In 2010, the unemployment rate was ________ percent.
A) 50.1
B) 9.6
C) 39.8
D) 6.2
E) 10.6
Unlock Deck
Unlock for access to all 119 flashcards in this deck.
Unlock Deck
k this deck
7
Refer to the following figure when answering the following questions.
Figure 7.2: United Kingdom Unemployment Rate: 1971-2015 (Source: OECD and Federal Reserve Economic Data, Federal Reserve Bank of St. Louis)
Given the U.K. unemployment rate data depicted in Figure 7.2, the approximate year of the peak of the boom was:
A) 1989.
B) 1986.
C) 1992.
D) 2009.
E) 1972.
Figure 7.2: United Kingdom Unemployment Rate: 1971-2015
(Source: OECD and Federal Reserve Economic Data, Federal Reserve Bank of St. Louis)Given the U.K. unemployment rate data depicted in Figure 7.2, the approximate year of the peak of the boom was:
A) 1989.
B) 1986.
C) 1992.
D) 2009.
E) 1972.
Unlock Deck
Unlock for access to all 119 flashcards in this deck.
Unlock Deck
k this deck
8
Over the past 50 years or so, the:
A) male employment-population ratio always has been rising.
B) female employment-population ratio generally has been falling.
C) male employment-population ratio generally has been rising.
D) female employment-population ratio generally has been rising.
E) None of these answers is correct.
A) male employment-population ratio always has been rising.
B) female employment-population ratio generally has been falling.
C) male employment-population ratio generally has been rising.
D) female employment-population ratio generally has been rising.
E) None of these answers is correct.
Unlock Deck
Unlock for access to all 119 flashcards in this deck.
Unlock Deck
k this deck
9
The labor market determines the:
A) equilibrium wage.
B) equilibrium quantity of employment.
C) equilibrium wage and the quantity of employment.
D) number of unemployed.
E) All of these answers are correct.
A) equilibrium wage.
B) equilibrium quantity of employment.
C) equilibrium wage and the quantity of employment.
D) number of unemployed.
E) All of these answers are correct.
Unlock Deck
Unlock for access to all 119 flashcards in this deck.
Unlock Deck
k this deck
10
Refer to the following table to answer the following questions.
Table 7.1: U.S. Employment Status (in thousands)
Consider Table 7.1. Between 2010 and 2015, the employment-population ratio ________ to/at ________.
A) fell; 58.5 percent
B) rose; 90.4 percent
C) stayed more or less the same; 37.9 percent
D) fell; 5.3 percent
E) rose; 59.3 percent
Table 7.1: U.S. Employment Status (in thousands)
Consider Table 7.1. Between 2010 and 2015, the employment-population ratio ________ to/at ________.
A) fell; 58.5 percent
B) rose; 90.4 percent
C) stayed more or less the same; 37.9 percent
D) fell; 5.3 percent
E) rose; 59.3 percent
Unlock Deck
Unlock for access to all 119 flashcards in this deck.
Unlock Deck
k this deck
11
Beginning in 2007, the ________ to roughly mid-1980s levels.
A) employment-population ratio rose
B) unemployment rate fell
C) inflation rate rose
D) share of women in the labor force fell
E) employment-population ratio fell
A) employment-population ratio rose
B) unemployment rate fell
C) inflation rate rose
D) share of women in the labor force fell
E) employment-population ratio fell
Unlock Deck
Unlock for access to all 119 flashcards in this deck.
Unlock Deck
k this deck
12
Refer to the following table to answer the following questions.
Table 7.1: U.S. Employment Status (in thousands)
Consider Table 7.1. Between 2010 and 2015, the unemployment rate ________ and the employment-population ratio ________ (rounded to 1 decimal point).
A) rose; fell
B) rose; rose
C) fell; rose
D) fell; fell
E) Not enough information is given.
Table 7.1: U.S. Employment Status (in thousands)
Consider Table 7.1. Between 2010 and 2015, the unemployment rate ________ and the employment-population ratio ________ (rounded to 1 decimal point).
A) rose; fell
B) rose; rose
C) fell; rose
D) fell; fell
E) Not enough information is given.
Unlock Deck
Unlock for access to all 119 flashcards in this deck.
Unlock Deck
k this deck
13
Refer to the following table to answer the following questions.
Table 7.1: U.S. Employment Status (in thousands)
Consider Table 7.1. In 2015, the unemployment rate was ________ percent.
A) 39.0
B) 3.3
C) 5.6
D) 58.3
E) 5.3
Table 7.1: U.S. Employment Status (in thousands)
Consider Table 7.1. In 2015, the unemployment rate was ________ percent.
A) 39.0
B) 3.3
C) 5.6
D) 58.3
E) 5.3
Unlock Deck
Unlock for access to all 119 flashcards in this deck.
Unlock Deck
k this deck
14
If the U.S. real output is growing, and labor income accounts for about two-thirds of this:
A) the unemployment rate is falling.
B) on average, capital is getting poorer over time.
C) income inequality is decreasing.
D) on average, workers are getting richer over time.
E) we are not getting any better off.
A) the unemployment rate is falling.
B) on average, capital is getting poorer over time.
C) income inequality is decreasing.
D) on average, workers are getting richer over time.
E) we are not getting any better off.
Unlock Deck
Unlock for access to all 119 flashcards in this deck.
Unlock Deck
k this deck
15
Refer to the following figure to answer the following questions.
Figure 7.1: U.S. Unemployment Rate: 1975-2015 (Source: U.S. Bureau of Labor Statistics)
Using Figure 7.1, The approximate year of the peak of the boom was:
A) 1982.
B) 1992.
C) 2005.
D) 2010.
E) 1990.
Figure 7.1: U.S. Unemployment Rate: 1975-2015
(Source: U.S. Bureau of Labor Statistics)Using Figure 7.1, The approximate year of the peak of the boom was:
A) 1982.
B) 1992.
C) 2005.
D) 2010.
E) 1990.
Unlock Deck
Unlock for access to all 119 flashcards in this deck.
Unlock Deck
k this deck
16
Refer to the following table to answer the following questions.
Table 7.1: U.S. Employment Status (in thousands)
Consider Table 7.1. In 2010, the employment-population ratio was ________ percent.
A) 64.7
B) 60.2
C) 9.6
D) 58.5
E) 90.4
Table 7.1: U.S. Employment Status (in thousands)
Consider Table 7.1. In 2010, the employment-population ratio was ________ percent.
A) 64.7
B) 60.2
C) 9.6
D) 58.5
E) 90.4
Unlock Deck
Unlock for access to all 119 flashcards in this deck.
Unlock Deck
k this deck
17
Refer to the following figure to answer the following questions.
Figure 7.1: U.S. Unemployment Rate: 1975-2015 (Source: U.S. Bureau of Labor Statistics)
Using Figure 7.1, Which of the following year(s) are the approximate trough of a recession?
A) 2001
B) 1983
C) 1979
D) 2012
E) All of these answers are correct.
Figure 7.1: U.S. Unemployment Rate: 1975-2015
(Source: U.S. Bureau of Labor Statistics)Using Figure 7.1, Which of the following year(s) are the approximate trough of a recession?
A) 2001
B) 1983
C) 1979
D) 2012
E) All of these answers are correct.
Unlock Deck
Unlock for access to all 119 flashcards in this deck.
Unlock Deck
k this deck
18
Refer to the following figure to answer the following questions.
Figure 7.1: U.S. Unemployment Rate: 1975-2015 (Source: U.S. Bureau of Labor Statistics)
Using Figure 7.1, Which of the following year(s) are the approximate trough of a recession?
A) 1975
B) 1983
C) 2011
D) All of these answers are correct.
E) None of these answers is correct.
Figure 7.1: U.S. Unemployment Rate: 1975-2015
(Source: U.S. Bureau of Labor Statistics)Using Figure 7.1, Which of the following year(s) are the approximate trough of a recession?
A) 1975
B) 1983
C) 2011
D) All of these answers are correct.
E) None of these answers is correct.
Unlock Deck
Unlock for access to all 119 flashcards in this deck.
Unlock Deck
k this deck
19
Over the course of his or her lifetime, the average American worker will spend ________ hours on the job.
A) 40,000
B) 1 million
C) 90,000
D) 100,000
E) 35,000
A) 40,000
B) 1 million
C) 90,000
D) 100,000
E) 35,000
Unlock Deck
Unlock for access to all 119 flashcards in this deck.
Unlock Deck
k this deck
20
The quote "It's a recession when your neighbor loses his job; it's a depression when you lose yours" is attributed to:
A) Karl Marx.
B) Franklin D. Roosevelt.
C) John Maynard Keynes.
D) Harry S. Truman.
E) Alan Greenspan.
A) Karl Marx.
B) Franklin D. Roosevelt.
C) John Maynard Keynes.
D) Harry S. Truman.
E) Alan Greenspan.
Unlock Deck
Unlock for access to all 119 flashcards in this deck.
Unlock Deck
k this deck
21
In the labor market depicted in Figure 7.3, a decrease in labor regulation shifts labor:
A) supply from to .
B) demand from to .
C) demand from to .
D) supply from to .
E) None of these answers is correct.
A) supply from
to .B) demand from
to .C) demand from
to .D) supply from
to .E) None of these answers is correct.
Unlock Deck
Unlock for access to all 119 flashcards in this deck.
Unlock Deck
k this deck
22
A decrease in the income tax will result in:
A) the labor demand curve shifting right.
B) the labor demand curve shifting left.
C) the labor supply curve shifting left and the labor demand curve shifting right.
D) the labor supply curve shifting right.
E) neither the labor supply nor the demand curve shifting.
A) the labor demand curve shifting right.
B) the labor demand curve shifting left.
C) the labor supply curve shifting left and the labor demand curve shifting right.
D) the labor supply curve shifting right.
E) neither the labor supply nor the demand curve shifting.
Unlock Deck
Unlock for access to all 119 flashcards in this deck.
Unlock Deck
k this deck
23
If the income taxes on wages increase, the labor supply curve will shift left, but what happens to the unemployment rate?
A) It unambiguously falls because the labor participation rate changes.
B) It unambiguously falls because some workers drop out of the workforce.
C) It unambiguously rises because some workers drop out of the workforce.
D) It is ambiguous because some workers drop out of the workforce.
E) None of these answers is correct.
Unlock Deck
Unlock for access to all 119 flashcards in this deck.
Unlock Deck
k this deck
24
Most of the total weeks of lost work are accounted for by:
A) retirees.
B) people who are discouraged workers.
C) people who are incarcerated.
D) people who are unemployed for a long period of time.
E) None of these answers is correct.
A) retirees.
B) people who are discouraged workers.
C) people who are incarcerated.
D) people who are unemployed for a long period of time.
E) None of these answers is correct.
Unlock Deck
Unlock for access to all 119 flashcards in this deck.
Unlock Deck
k this deck
25
Refer to the following figure when answering the following questions.
Figure 7.2: United Kingdom Unemployment Rate: 1971-2015 (Source: OECD and Federal Reserve Economic Data, Federal Reserve Bank of St. Louis)
Given the U.K. unemployment rate data depicted in Figure 7.2, the year of the trough of a recession was:
A) 1991.
B) 2006.
C) 1981.
D) 1973.
E) 1993.
Figure 7.2: United Kingdom Unemployment Rate: 1971-2015
(Source: OECD and Federal Reserve Economic Data, Federal Reserve Bank of St. Louis)Given the U.K. unemployment rate data depicted in Figure 7.2, the year of the trough of a recession was:
A) 1991.
B) 2006.
C) 1981.
D) 1973.
E) 1993.
Unlock Deck
Unlock for access to all 119 flashcards in this deck.
Unlock Deck
k this deck
26
In the labor market depicted in Figure 7.3, an increase in oil prices:
A) shifts labor demand from to .
B) shifts labor supply from to .
C) shifts labor demand from to .
D) produces no change in either the labor supply or demand curve.
E) None of these answers is correct.
A) shifts labor demand from
to .B) shifts labor supply from
to .C) shifts labor demand from
to .D) produces no change in either the labor supply or demand curve.
E) None of these answers is correct.
Unlock Deck
Unlock for access to all 119 flashcards in this deck.
Unlock Deck
k this deck
27
In March 2016, the United States imposed tariffs on steel imports from China. Using the labor market depicted in Figure 7.3, this would have the impact on the steel labor market of shifting labor:
A) supply from to .
B) demand from to .
C) demand from to .
D) supply from to .
E) None of these answers is correct.
A) supply from
to .B) demand from
to .C) demand from
to .D) supply from
to .E) None of these answers is correct.
Unlock Deck
Unlock for access to all 119 flashcards in this deck.
Unlock Deck
k this deck
28
An increase in labor regulations results in:
A) the supply curve shifting left.
B) the labor demand curve shifting left.
C) the labor supply curve shifting left and the labor demand curve shifting right.
D) the labor demand curve shifting right.
E) neither the labor supply nor the demand curve shifting.
A) the supply curve shifting left.
B) the labor demand curve shifting left.
C) the labor supply curve shifting left and the labor demand curve shifting right.
D) the labor demand curve shifting right.
E) neither the labor supply nor the demand curve shifting.
Unlock Deck
Unlock for access to all 119 flashcards in this deck.
Unlock Deck
k this deck
29
The demand for labor curve is:
A) downward sloping.
B) derived from the firm's profit maximization problem.
C) equal to the marginal product of labor.
D) derived from the marginal product of labor.
E) All of these answers are correct.
A) downward sloping.
B) derived from the firm's profit maximization problem.
C) equal to the marginal product of labor.
D) derived from the marginal product of labor.
E) All of these answers are correct.
Unlock Deck
Unlock for access to all 119 flashcards in this deck.
Unlock Deck
k this deck
30
The explanation for the upward-sloping supply of labor curve is that:
A) the marginal product of capital is positive.
B) as the wage rises, the opportunity cost of leisure rises, so people work more.
C) as the wage rises, people want to work less.
D) the marginal product of labor is diminishing.
E) None of these answers is correct.
A) the marginal product of capital is positive.
B) as the wage rises, the opportunity cost of leisure rises, so people work more.
C) as the wage rises, people want to work less.
D) the marginal product of labor is diminishing.
E) None of these answers is correct.
Unlock Deck
Unlock for access to all 119 flashcards in this deck.
Unlock Deck
k this deck
31
A drawback of unemployment benefits is that:
A) they increase job destruction.
B) they cost taxpayers over 50 percent of their incomes.
C) the payments are too large.
D) they always lengthen the time spent unemployed.
E) they give workers a disincentive to find work.
A) they increase job destruction.
B) they cost taxpayers over 50 percent of their incomes.
C) the payments are too large.
D) they always lengthen the time spent unemployed.
E) they give workers a disincentive to find work.
Unlock Deck
Unlock for access to all 119 flashcards in this deck.
Unlock Deck
k this deck
32
An increase in the income taxes on wages results in:
A) the labor demand curve shifting left.
B) the labor supply curve shifting left.
C) the labor supply and demand curves shifting left.
D) the labor demand curve shifting right.
E) neither the labor supply nor the demand curve shifting.
A) the labor demand curve shifting left.
B) the labor supply curve shifting left.
C) the labor supply and demand curves shifting left.
D) the labor demand curve shifting right.
E) neither the labor supply nor the demand curve shifting.
Unlock Deck
Unlock for access to all 119 flashcards in this deck.
Unlock Deck
k this deck
33
Historically, for most Americans, the length of unemployment is:
A) usually more than one year.
B) usually more than three months.
C) usually less than three months.
D) indefinite.
E) less than one week.
A) usually more than one year.
B) usually more than three months.
C) usually less than three months.
D) indefinite.
E) less than one week.
Unlock Deck
Unlock for access to all 119 flashcards in this deck.
Unlock Deck
k this deck
34
In the labor market depicted in Figure 7.3, investment in new physical capital shifts labor:
A) supply from to .
B) supply from to .
C) demand from to .
D) demand from to .
E) None of these answers is correct.
A) supply from
to .B) supply from
to .C) demand from
to .D) demand from
to .E) None of these answers is correct.
Unlock Deck
Unlock for access to all 119 flashcards in this deck.
Unlock Deck
k this deck
35
The unemployment rate is defined as the ratio of:
A) all adults not working to the total population.
B) unemployed to employed members of the labor force.
C) unemployed members of the labor force to the total labor force.
D) discouraged workers to the total population.
E) unemployed members of the labor force to the total population.
A) all adults not working to the total population.
B) unemployed to employed members of the labor force.
C) unemployed members of the labor force to the total labor force.
D) discouraged workers to the total population.
E) unemployed members of the labor force to the total population.
Unlock Deck
Unlock for access to all 119 flashcards in this deck.
Unlock Deck
k this deck
36
The labor demand curve slopes downward because:
A) wages are inflexible.
B) wages are higher when demand falls.
C) of the diminishing marginal product of labor.
D) of the income effect.
E) None of these answers is correct.
A) wages are inflexible.
B) wages are higher when demand falls.
C) of the diminishing marginal product of labor.
D) of the income effect.
E) None of these answers is correct.
Unlock Deck
Unlock for access to all 119 flashcards in this deck.
Unlock Deck
k this deck
37
Refer to the following figure when answering the following questions.
Figure 7.3: Labor Market
In the labor market depicted in Figure 7.3, an increase in the income tax would result in a shift in labor:
A) supply from to .
B) demand from to .
C) demand from to .
D) supply from to .
E) None of these answers is correct.
Figure 7.3: Labor Market
In the labor market depicted in Figure 7.3, an increase in the income tax would result in a shift in labor:
A) supply from
to .B) demand from
to .C) demand from
to .D) supply from
to .E) None of these answers is correct.
Unlock Deck
Unlock for access to all 119 flashcards in this deck.
Unlock Deck
k this deck
38
In the labor market, the intersection of the supply and demand for labor determines:
A) inflation and the real wage.
B) the wage and the population, N.
C) the interest rate and the unemployment rate.
D) the wage and the employment-population ratio, L /N.
E) the wage and the number of discouraged workers.
A) inflation and the real wage.
B) the wage and the population, N.
C) the interest rate and the unemployment rate.
D) the wage and the employment-population ratio, L /N.
E) the wage and the number of discouraged workers.
Unlock Deck
Unlock for access to all 119 flashcards in this deck.
Unlock Deck
k this deck
39
The net change in employment is:
A) new jobs.
B) the difference between job creation and job destruction.
C) called job creation.
D) the unemployment rate.
E) the labor force participation rate.
A) new jobs.
B) the difference between job creation and job destruction.
C) called job creation.
D) the unemployment rate.
E) the labor force participation rate.
Unlock Deck
Unlock for access to all 119 flashcards in this deck.
Unlock Deck
k this deck
40
In the labor market depicted in Figure 7.3, an increase in the income tax would result in:
A) a shift in labor supply from to .
B) a shift in labor demand from to .
C) a shift in labor demand from to .
D) no change in either the labor supply or demand curve.
E) None of these answers is correct.
A) a shift in labor supply from
to .B) a shift in labor demand from
to .C) a shift in labor demand from
to .D) no change in either the labor supply or demand curve.
E) None of these answers is correct.
Unlock Deck
Unlock for access to all 119 flashcards in this deck.
Unlock Deck
k this deck
41
Any institutional fixed wage set above the equilibrium wage is called:
A) the market wage.
B) a minimum wage.
C) a wage rigidity.
D) a real rigidity.
E) a wage ceiling.
A) the market wage.
B) a minimum wage.
C) a wage rigidity.
D) a real rigidity.
E) a wage ceiling.
Unlock Deck
Unlock for access to all 119 flashcards in this deck.
Unlock Deck
k this deck
42
Refer to the following figure when answering the following questions.
Figure 7.4: Labor Market
Consider the labor market depicted in Figure 7.4. The wage, fixed at , is called ________ and ________.
A) a wage rigidity; reduces unemployment
B) a wage rigidity; decreases labor market volatility
C) a flexible wage; increases labor market volatility
D) a wage rigidity; increases labor market volatility
E) the market wage; increases unemployment
Figure 7.4: Labor Market
Consider the labor market depicted in Figure 7.4. The wage, fixed at
, is called ________ and ________.A) a wage rigidity; reduces unemployment
B) a wage rigidity; decreases labor market volatility
C) a flexible wage; increases labor market volatility
D) a wage rigidity; increases labor market volatility
E) the market wage; increases unemployment
Unlock Deck
Unlock for access to all 119 flashcards in this deck.
Unlock Deck
k this deck
43
Frictional unemployment is the unemployment that results from:
A) workers losing jobs during recession.
B) workers losing jobs during seasonal changes.
C) workers changing jobs in a dynamic economy.
D) prevailing labor market institutions.
E) workers leaving the labor force.
A) workers losing jobs during recession.
B) workers losing jobs during seasonal changes.
C) workers changing jobs in a dynamic economy.
D) prevailing labor market institutions.
E) workers leaving the labor force.
Unlock Deck
Unlock for access to all 119 flashcards in this deck.
Unlock Deck
k this deck
44
The cause(s) of increased female participation in the labor market is/are:
A) changing social norms.
B) technological changes in managing fertility.
C) increased discrimination.
D) the baby boom.
E) changing social norms and increased discrimination.
A) changing social norms.
B) technological changes in managing fertility.
C) increased discrimination.
D) the baby boom.
E) changing social norms and increased discrimination.
Unlock Deck
Unlock for access to all 119 flashcards in this deck.
Unlock Deck
k this deck
45
Structural unemployment is the unemployment that results from:
A) workers leaving the labor force.
B) workers changing jobs in a dynamic economy.
C) workers losing jobs during seasonal changes.
D) workers losing jobs during recession.
E) prevailing labor market institutions.
A) workers leaving the labor force.
B) workers changing jobs in a dynamic economy.
C) workers losing jobs during seasonal changes.
D) workers losing jobs during recession.
E) prevailing labor market institutions.
Unlock Deck
Unlock for access to all 119 flashcards in this deck.
Unlock Deck
k this deck
46
Cyclical unemployment is the unemployment that results from:
A) prevailing labor market institutions.
B) workers losing jobs during recession.
C) workers changing jobs in a dynamic economy.
D) workers losing jobs during seasonal changes.
E) workers leaving the labor force.
A) prevailing labor market institutions.
B) workers losing jobs during recession.
C) workers changing jobs in a dynamic economy.
D) workers losing jobs during seasonal changes.
E) workers leaving the labor force.
Unlock Deck
Unlock for access to all 119 flashcards in this deck.
Unlock Deck
k this deck
47
The natural rate of unemployment is the unemployment rate that would prevail:
A) if inflation were zero.
B) if there were no discouraged workers.
C) if the economy were in neither a boom nor a recession.
D) during seasonal changes in the economy.
E) if the unemployment rate were zero.
A) if inflation were zero.
B) if there were no discouraged workers.
C) if the economy were in neither a boom nor a recession.
D) during seasonal changes in the economy.
E) if the unemployment rate were zero.
Unlock Deck
Unlock for access to all 119 flashcards in this deck.
Unlock Deck
k this deck
48
Because of the dynamics of the workforce, for example, whether workers become discouraged when there are changes in the economy:
A) the unemployment rate is not necessarily an accurate gauge of the labor market.
B) the unemployment rate is a precise gauge of the labor market.
C) one should only consider the employment-population ratio rather than the unemployment rate.
D) at times the labor demand curve is upward sloping.
E) None of these answers is correct.
Unlock Deck
Unlock for access to all 119 flashcards in this deck.
Unlock Deck
k this deck
49
Unemployment is given by ________ unemployment and the natural rate of unemployment includes ________ unemployment.
A) frictional +structural -cyclical; frictional + structural
B) frictional +structural - cyclical; frictional + structural
C) frictional + cyclical; frictional + cyclical
D) structural + cyclical; structural
E) cyclical; frictional + structural
A) frictional +structural -cyclical; frictional + structural
B) frictional +structural - cyclical; frictional + structural
C) frictional + cyclical; frictional + cyclical
D) structural + cyclical; structural
E) cyclical; frictional + structural
Unlock Deck
Unlock for access to all 119 flashcards in this deck.
Unlock Deck
k this deck
50
Refer to the following table 7.2 when answering the following questions.
Consider the data in Table 7.2. Using the "bathtub model" of unemployment, in 2010 the natural rate of unemployment was ________ percent.
A) 94.6
B) 5.7
C) 5.4
D) 19.6
E) 8.6
Consider the data in Table 7.2. Using the "bathtub model" of unemployment, in 2010 the natural rate of unemployment was ________ percent.
A) 94.6
B) 5.7
C) 5.4
D) 19.6
E) 8.6
Unlock Deck
Unlock for access to all 119 flashcards in this deck.
Unlock Deck
k this deck
51
If the minimum wage is set below the equilibrium market wage, it:
A) increases unemployment.
B) is effective and reduces unemployment.
C) equals the black market wage.
D) is lower than firms are willing to pay for labor.
E) None of these answers is correct.
A) increases unemployment.
B) is effective and reduces unemployment.
C) equals the black market wage.
D) is lower than firms are willing to pay for labor.
E) None of these answers is correct.
Unlock Deck
Unlock for access to all 119 flashcards in this deck.
Unlock Deck
k this deck
52
The gradual rise in unemployment in the 1960s and 1970s, in part, is explained by:
A) the Vietnam War.
B) increased female participation in the labor force.
C) the baby boomers.
D) All of these answers are correct.
E) None of these answers is correct.
A) the Vietnam War.
B) increased female participation in the labor force.
C) the baby boomers.
D) All of these answers are correct.
E) None of these answers is correct.
Unlock Deck
Unlock for access to all 119 flashcards in this deck.
Unlock Deck
k this deck
53
The rise in the employment-population ratio between 1950 and 2010 largely is due to:
A) a shrinking U.S. population.
B) more teenagers entering the labor force.
C) more women entering the labor force.
D) an increase in immigrant workers.
E) It is unexplained.
A) a shrinking U.S. population.
B) more teenagers entering the labor force.
C) more women entering the labor force.
D) an increase in immigrant workers.
E) It is unexplained.
Unlock Deck
Unlock for access to all 119 flashcards in this deck.
Unlock Deck
k this deck
54
If the minimum wage is set above the equilibrium market wage, it:
A) increases unemployment.
B) is effective and reduces unemployment.
C) equals the black market wage.
D) is lower than firms are willing to pay for labor.
E) does not affect the market equilibrium.
A) increases unemployment.
B) is effective and reduces unemployment.
C) equals the black market wage.
D) is lower than firms are willing to pay for labor.
E) does not affect the market equilibrium.
Unlock Deck
Unlock for access to all 119 flashcards in this deck.
Unlock Deck
k this deck
55
The natural rate of unemployment is the unemployment rate that would prevail:
A) during changes in the business cycle.
B) if the economy were in neither a boom nor a recession.
C) if people voluntarily left work.
D) during seasonal changes in the economy.
E) if the unemployment rate were zero.
A) during changes in the business cycle.
B) if the economy were in neither a boom nor a recession.
C) if people voluntarily left work.
D) during seasonal changes in the economy.
E) if the unemployment rate were zero.
Unlock Deck
Unlock for access to all 119 flashcards in this deck.
Unlock Deck
k this deck
56
One consequence of wage rigidity is:
A) lower rates of unemployment.
B) less labor market volatility.
C) labor market stability.
D) a lower unemployment rate.
E) None of these answers is correct.
A) lower rates of unemployment.
B) less labor market volatility.
C) labor market stability.
D) a lower unemployment rate.
E) None of these answers is correct.
Unlock Deck
Unlock for access to all 119 flashcards in this deck.
Unlock Deck
k this deck
57
Refer to the following figure when answering the following questions.
Figure 7.4: Labor Market
Consider the labor market depicted in Figure 7.4. If the market wage is fixed at , it is called ________ and it ________ unemployment.
A) a wage ceiling; does nothing to
B) a wage rigidity; increases
C) the market wage; does nothing to
D) the market wage; increases
E) a wage rigidity; decreases
Figure 7.4: Labor Market
Consider the labor market depicted in Figure 7.4. If the market wage is fixed at
, it is called ________ and it ________ unemployment.A) a wage ceiling; does nothing to
B) a wage rigidity; increases
C) the market wage; does nothing to
D) the market wage; increases
E) a wage rigidity; decreases
Unlock Deck
Unlock for access to all 119 flashcards in this deck.
Unlock Deck
k this deck
58
Wage rigidity:
A) helps the labor market achieve equilibrium.
B) prevents the capital market from realizing equilibrium.
C) prevents the labor market from realizing equilibrium.
D) prevents unemployment.
E) None of these answers is correct.
A) helps the labor market achieve equilibrium.
B) prevents the capital market from realizing equilibrium.
C) prevents the labor market from realizing equilibrium.
D) prevents unemployment.
E) None of these answers is correct.
Unlock Deck
Unlock for access to all 119 flashcards in this deck.
Unlock Deck
k this deck
59
The natural rate of unemployment is decomposed into ________ unemployment.
A) cyclical and frictional
B) structural and seasonal
C) structural and frictional
D) seasonal and frictional
E) structural, frictional, and seasonal
A) cyclical and frictional
B) structural and seasonal
C) structural and frictional
D) seasonal and frictional
E) structural, frictional, and seasonal
Unlock Deck
Unlock for access to all 119 flashcards in this deck.
Unlock Deck
k this deck
60
Conventional wisdom is that most of the natural rate of unemployment is due to:
A) bad fiscal policy.
B) frictional unemployment.
C) cyclical unemployment.
D) structural unemployment.
E) bad monetary policy.
A) bad fiscal policy.
B) frictional unemployment.
C) cyclical unemployment.
D) structural unemployment.
E) bad monetary policy.
Unlock Deck
Unlock for access to all 119 flashcards in this deck.
Unlock Deck
k this deck
61
The idea that you value receiving $1,000 today more than in 10 years in the future is called:
A) real rate of return.
B) compound interest.
C) present discounted value.
D) utility maximization.
E) intertemporal substitution.
A) real rate of return.
B) compound interest.
C) present discounted value.
D) utility maximization.
E) intertemporal substitution.
Unlock Deck
Unlock for access to all 119 flashcards in this deck.
Unlock Deck
k this deck
62
The percentage of total hours worked by the supply of college-educated workers compared to the percentage of total hours worked by high school- educated workers has been:
A) constant.
B) climbing steadily to about 20 percent.
C) falling steadily to about 50 percent.
D) climbing steadily to about 50 percent.
E) None of these answers is correct.
A) constant.
B) climbing steadily to about 20 percent.
C) falling steadily to about 50 percent.
D) climbing steadily to about 50 percent.
E) None of these answers is correct.
Unlock Deck
Unlock for access to all 119 flashcards in this deck.
Unlock Deck
k this deck
63
A key reason that unemployment in the United States is so low compared to most of Europe is because of ________ unemployment.
A) no cyclical
B) low frictional
C) high structural
D) low structural
E) no structural
A) no cyclical
B) low frictional
C) high structural
D) low structural
E) no structural
Unlock Deck
Unlock for access to all 119 flashcards in this deck.
Unlock Deck
k this deck
64
According to data presented in the text, the country with the lowest number of working hours per week in 2010 was:
A) France.
B) Japan.
C) Canada.
D) the United Kingdom.
E) the United States.
A) France.
B) Japan.
C) Canada.
D) the United Kingdom.
E) the United States.
Unlock Deck
Unlock for access to all 119 flashcards in this deck.
Unlock Deck
k this deck
65
One possible explanation for a high steady-state level of unemployment is:
A) the existence of a small number of institutional restrictions.
B) a shrinking labor force.
C) perfectly flexible wages.
D) a high job-separation rate.
E) a rising job-finding rate.
A) the existence of a small number of institutional restrictions.
B) a shrinking labor force.
C) perfectly flexible wages.
D) a high job-separation rate.
E) a rising job-finding rate.
Unlock Deck
Unlock for access to all 119 flashcards in this deck.
Unlock Deck
k this deck
66
Of the richest countries, ________ worked the most hours per week in 2010.
A) Germans
B) Americans
C) the Japanese
D) Canadians
E) Australians
A) Germans
B) Americans
C) the Japanese
D) Canadians
E) Australians
Unlock Deck
Unlock for access to all 119 flashcards in this deck.
Unlock Deck
k this deck
67
Europe's relatively high unemployment rates can be attributed to:
A) adverse shocks.
B) inefficient labor market institutions.
C) strong labor unions.
D) generous unemployment insurance.
E) All of these answers are correct.
A) adverse shocks.
B) inefficient labor market institutions.
C) strong labor unions.
D) generous unemployment insurance.
E) All of these answers are correct.
Unlock Deck
Unlock for access to all 119 flashcards in this deck.
Unlock Deck
k this deck
68
Beginning in ________, the wage premium began ________.
A) 1980; slowing down
B) 1980; accelerating
C) 1963; trending down
D) 1970; accelerating
E) 1970; rising
A) 1980; slowing down
B) 1980; accelerating
C) 1963; trending down
D) 1970; accelerating
E) 1970; rising
Unlock Deck
Unlock for access to all 119 flashcards in this deck.
Unlock Deck
k this deck
69
You win the lottery, which pays $1 million in 20 annual $50,000 payments. Your friends ask how much that would be if you received a single lump sum payment today. You do not have your calculator, but you show them which of the following equations to help them solve it themselves, assuming the interest rate is 10 percent?
A)
B)
C) (50,000 * 20)/1.1
D)
E) PV=$1,000,000/1.10
A)
B)
C) (50,000 * 20)/1.1
D)
E) PV=$1,000,000/1.10
Unlock Deck
Unlock for access to all 119 flashcards in this deck.
Unlock Deck
k this deck
70
In 2010, the college wage premium was about ________ percent more than the wage of the typical worker with a high school education.
A) 50
B) 10
C) 100
D) 90
E) None of these answers is correct.
A) 50
B) 10
C) 100
D) 90
E) None of these answers is correct.
Unlock Deck
Unlock for access to all 119 flashcards in this deck.
Unlock Deck
k this deck
71
In the "bathtub model " of unemployment, the key equation is:
A) .
B) .
C) .
D) .
E) .
A)
.B)
.C)
.D)
.E)
. Unlock Deck
Unlock for access to all 119 flashcards in this deck.
Unlock Deck
k this deck
72
Refer to the following table 7.2 when answering the following questions.
Consider the data in Table 7.2. Using the "bathtub model" of unemployment, in 2015 the natural rate of unemployment was ________ percent.
A) 7.0
B) 7.5
C) 5.0
D) 93.0
E) 30.6
Consider the data in Table 7.2. Using the "bathtub model" of unemployment, in 2015 the natural rate of unemployment was ________ percent.
A) 7.0
B) 7.5
C) 5.0
D) 93.0
E) 30.6
Unlock Deck
Unlock for access to all 119 flashcards in this deck.
Unlock Deck
k this deck
73
Consider the simplified payment system to compensate the victims of 9/11 for lost lifetime earnings:
• The family of a 65-year-old service worker earning $10,000 a year receives $300,000 in compensation.
• The family of a 30-year-old bond trader earning $175,000 a year receives $4.35 million.
Which statement most accurately describes the difference in the payments between the service worker and the bond trader?
A) The present value of the bond trader's lifetime income is greater than the service worker's.
B) Because of her age, the bond trader had less savings to rely on, so her family received more compensation.
C) The future value of the bond trader's lifetime income is less than the service worker's.
D) Such a discrepancy in compensation would never be the case.
E) None of these answers is correct.
Unlock Deck
Unlock for access to all 119 flashcards in this deck.
Unlock Deck
k this deck
74
Refer to the following table 7.2 when answering the following questions.
Consider the data in Table 7.2. In ________, the natural rate of unemployment was the higher of the two years at ________ percent.
A) 2015; 7.0
B) 2010; 94.6
C) 2010; 8.6
D) 2015; 7.5
E) 2015; 5.0
Consider the data in Table 7.2. In ________, the natural rate of unemployment was the higher of the two years at ________ percent.
A) 2015; 7.0
B) 2010; 94.6
C) 2010; 8.6
D) 2015; 7.5
E) 2015; 5.0
Unlock Deck
Unlock for access to all 119 flashcards in this deck.
Unlock Deck
k this deck
75
Which of the following is NOT a potential reason for offering a wage above the market wage?
A) A higher wage contributes to improved worker health.
B) A higher wage makes the opportunity cost of losing a job higher, thus reducing "shirking."
C) It reduces moral hazard.
D) Higher wages attract more productive workers.
E) Higher wages signal prestige and thus attract workers from elite schools.
Unlock Deck
Unlock for access to all 119 flashcards in this deck.
Unlock Deck
k this deck
76
In the 1960s, European unemployment rates were ________ as /compared to the United States and now are ________.
A) much higher; much higher
B) much lower; about the same
C) much lower; higher
D) about the same; much lower
E) None of these answers is correct.
A) much higher; much higher
B) much lower; about the same
C) much lower; higher
D) about the same; much lower
E) None of these answers is correct.
Unlock Deck
Unlock for access to all 119 flashcards in this deck.
Unlock Deck
k this deck
77
The present discounted value equation, , means you:
A) would prefer to receive $386 today rather than $1,000 in 10 years.
B) are indifferent between receiving $386 today and $1,000 in 10 years.
C) would prefer to receive $1,000 in 10 years rather than $386 today.
D) are indifferent between receiving $386 today and $1,000 in 100 years.
E) Not enough information is given.
, means you:A) would prefer to receive $386 today rather than $1,000 in 10 years.
B) are indifferent between receiving $386 today and $1,000 in 10 years.
C) would prefer to receive $1,000 in 10 years rather than $386 today.
D) are indifferent between receiving $386 today and $1,000 in 100 years.
E) Not enough information is given.
Unlock Deck
Unlock for access to all 119 flashcards in this deck.
Unlock Deck
k this deck
78
________ historically has generally had the lowest unemployment rate since 1960.
A) The United States
B) Japan
C) France
D) The United Kingdom
E) Germany
A) The United States
B) Japan
C) France
D) The United Kingdom
E) Germany
Unlock Deck
Unlock for access to all 119 flashcards in this deck.
Unlock Deck
k this deck
79
In the "bathtub model" of unemployment, in the steady state:
A) employment is constant.
B) the change in unemployment is zero.
C) the natural rate of unemployment is zero.
D) cyclical unemployment equals frictional unemployment.
E) the job-separation rate is zero.
A) employment is constant.
B) the change in unemployment is zero.
C) the natural rate of unemployment is zero.
D) cyclical unemployment equals frictional unemployment.
E) the job-separation rate is zero.
Unlock Deck
Unlock for access to all 119 flashcards in this deck.
Unlock Deck
k this deck
80
________ offered his workers ________ per day.
A) Andrew Carnegie; $1
B) Donald Trump; $500
C) Henry Ford; $5
D) Franklin D. Roosevelt; $10
E) John D. Rockefeller; $20
A) Andrew Carnegie; $1
B) Donald Trump; $500
C) Henry Ford; $5
D) Franklin D. Roosevelt; $10
E) John D. Rockefeller; $20
Unlock Deck
Unlock for access to all 119 flashcards in this deck.
Unlock Deck
k this deck
Unlock Deck
Unlock for access to all 119 flashcards in this deck.


