Exam 7: The Labor Market, Wages, and Unemployment
Exam 1: Introduction to Macroeconomics35 Questions
Exam 2: Measuring the Macroeconomy114 Questions
Exam 3: An Overview of Long-Run Economic Growth110 Questions
Exam 4: A Model of Production129 Questions
Exam 5: The Solow Growth Model126 Questions
Exam 6: Growth and Ideas120 Questions
Exam 7: The Labor Market, Wages, and Unemployment119 Questions
Exam 8: Inflation117 Questions
Exam 9: An Introduction to the Short Run113 Questions
Exam 10: The Great Recession: a First Look108 Questions
Exam 11: The Is Curve128 Questions
Exam 12: Monetary Policy and the Phillips Curve135 Questions
Exam 13: Stabilization Policy and the Asad Framework113 Questions
Exam 14: The Great Recession and the Short-Run Model112 Questions
Exam 15: Dsge Models: the Frontier of Business Cycle Research119 Questions
Exam 16: Consumption109 Questions
Exam 17: Investment116 Questions
Exam 18: The Government and the Macroeconomy122 Questions
Exam 19: International Trade107 Questions
Exam 20: Exchange Rates and International Finance142 Questions
Exam 21: Parting Thoughts35 Questions
Select questions type
Which of the following is NOT a potential reason for offering a wage above the market wage?
Free
(Multiple Choice)
4.8/5  (23)
(23)
Correct Answer: Verified
E
The idea that you value receiving $1,000 today more than 10 years in the future is called compound interest.
Free
(True/False)
4.9/5 (34)
Correct Answer:Verified
False
In the labor market depicted in Figure 7.3, an increase in oil prices:
Free
(Multiple Choice)
4.7/5 (35)
Correct Answer:Verified
C
The natural rate of unemployment is the unemployment rate that would prevail:
(Multiple Choice)
5.0/5 (42)
Refer to the following figure to answer the following questions.
Figure 7.1: U.S. Unemployment Rate: 1975-2015 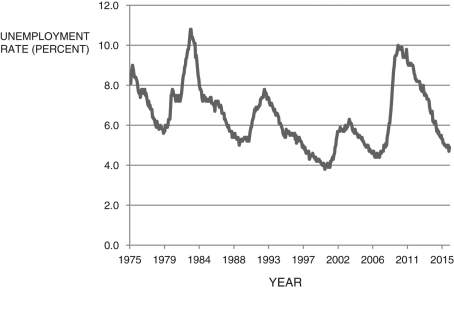 (Source: U.S. Bureau of Labor Statistics)
-Using Figure 7.1, Which of the following year(s) are the approximate trough of a recession?
(Source: U.S. Bureau of Labor Statistics)
-Using Figure 7.1, Which of the following year(s) are the approximate trough of a recession?
(Multiple Choice)
4.8/5 (30)
If the civilian noninstitutionalized population is 230,108, the number of employed is 145,926, the number of unemployed is 6,849, and the number of discouraged workers is 77,676, the unemployment rate is about 3.0 percent.
(True/False)
4.9/5 (34)
Refer to the following figure when answering the following questions.
Figure 7.5: Labor Market 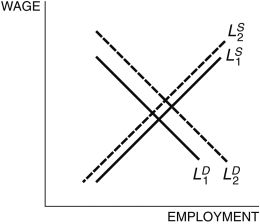 -Consider Figure 7.5. If the demand curve for college graduates is characterized by
  , which of the following is a reason why the demand for labor for college graduates is higher than that for high school students, characterized by
  ?
?
(Multiple Choice)
4.8/5 (35)
Refer to the following table to answer the following questions.
Table 7.1: U.S. Employment Status (in thousands) 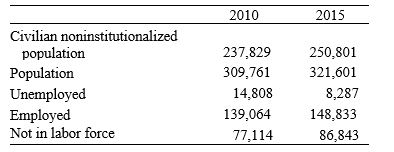 -Consider Table 7.1. Between 2010 and 2015, the unemployment rate ________ and the employment-population ratio ________ (rounded to 1 decimal point).
(Multiple Choice)
4.9/5 (33)
The cause(s) of increased female participation in the labor market is/are:
(Multiple Choice)
4.8/5 (34)
If the minimum wage is set below the equilibrium wage, it will have no effect on unemployment.
(True/False)
4.8/5 (32)
The supply of labor curve slopes upward because, with a higher wage, the opportunity cost of leisure rises.
(True/False)
4.9/5 (40)
The labor demand curve is derived from the marginal product of labor.
(True/False)
4.8/5 (28)
The average unemployment benefit of an American worker is about $300 per week and lasts 26 weeks.
(True/False)
4.8/5 (32)
Unemployment due to institutional frictions is called structural unemployment.
(True/False)
4.9/5 (30)
Refer to the following table 7.2 when answering the following questions. 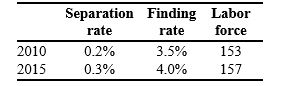 -Consider the data in Table 7.2. Using the "bathtub model" of unemployment, in 2015 the natural rate of unemployment was ________ percent.
(Multiple Choice)
4.8/5 (36)
What has been happening to cause returns to a college education over the past 50 years or so, compared to only receiving a high school education? What explains this difference?
(Essay)
4.7/5 (33)
The natural rate of unemployment is the unemployment rate that would prevail:
(Multiple Choice)
4.9/5 (40)
Beginning in 2007, the ________ to roughly mid-1980s levels.
(Multiple Choice)
4.9/5 (34)
Refer to the following table to answer the following questions.
Table 7.1: U.S. Employment Status (in thousands)
-Consider Table 7.1. In 2010, the employment-population ratio was ________ percent.
(Multiple Choice)
4.7/5 (38)
Filters
- Essay(0)
- Multiple Choice(0)
- Short Answer(0)
- True False(0)
- Matching(0)