Deck 5: The Solow Growth Model
Full screen (f)
Question
In the Solow model, if  , the capital stock:
A) declines.
B) stays the same.
C) grows.
D) Not enough information is given.
E) None of these answers is correct.
, the capital stock:A) declines.
B) stays the same.
C) grows.
D) Not enough information is given.
E) None of these answers is correct.
Question
Question
Question
Question
Question
In the Solow model, the parameter  denotes ________ and is ________.
A) investment; less than one
B) the depreciation rate; equal to zero
C) consumption; greater than one
D) the depreciation rate; less than one
E) investment; greater than one
denotes ________ and is ________.A) investment; less than one
B) the depreciation rate; equal to zero
C) consumption; greater than one
D) the depreciation rate; less than one
E) investment; greater than one
Question
Question
Question
Question
In the Solow model, the equation of capital accumulation is:
A) .
.
B) .
.
C) .
.
D) .
.
E) .
.
A)
.B)
.C)
.D)
.E)
. Question
Using the Solow model, if, in time t = 50, the capital stock is K50 =150, investment is I50 = 15, and  is the depreciation rate, capital accumulation from period 50 to 51 is:
A) K51 =5.
B) K51 =-15.
C) K51 = 15.
D) K51 = 120.
E) K51 =0.
is the depreciation rate, capital accumulation from period 50 to 51 is:A) K51 =5.
B) K51 =-15.
C) K51 = 15.
D) K51 = 120.
E) K51 =0.
Question
Using the Solow model, if, in time t = 0, the initial capital stock is K0 = 100, investment is I0 = 25, and  .1 is the depreciation rate, capital accumulation from period 0 to period 1 is:
A) K1 = 35.
B) K1 =-15.
C) K1 = 15.
D) K1 =0.
E) K1 = 115.
.1 is the depreciation rate, capital accumulation from period 0 to period 1 is:A) K1 = 35.
B) K1 =-15.
C) K1 = 15.
D) K1 =0.
E) K1 = 115.
Question
Question
Question
Question
If Ct denotes consumption, It denotes investment, and Yt is output, the resource constraint in the Solow model is:
A) Yt = Ct -It.
B) .
.
C) .
.
D) .
.
E) None of these answers is correct.
A) Yt = Ct -It.
B)
.C)
.D)
.E) None of these answers is correct.
Question
In the Solow model, defining  as the saving rate, Yt as output, and Ct as consumption, investment It is given by:
A) .
.
B) .
.
C) .
.
D) .
.
E) .
.
as the saving rate, Yt as output, and Ct as consumption, investment It is given by:A)
.B)
.C)
.D)
.E)
. Question
Question
In the Solow model, defining  as the saving rate, Yt as output, and It as investment, consumption is given by:
A) .
.
B) .
.
C) .
.
D) .
.
E) .
.
as the saving rate, Yt as output, and It as investment, consumption is given by:A)
.B)
.C)
.D)
.E)
. Question
The production function used in the Solow model is:
A) .
.
B) .
.
C) .
.
D) .
.
E) .
.
A)
.B)
.C)
.D)
.E)
. Question
Question
If we define the saving rate as  , output as
, and the depreciation rate as
And if
, the economy is:
A) contracting.
B) at the steady state.
C) growing.
D) in its short-run equilibrium.
E) None of these answers is correct.
, output as , and the depreciation rate as
And if
, the economy is:
A) contracting.
B) at the steady state.
C) growing.
D) in its short-run equilibrium.
E) None of these answers is correct.
Question
Question
Question
If we define the saving rate as  , output as
, and the depreciation rate as
And if
, the economy is:
A) contracting.
B) growing.
C) at the steady state.
D) in its short-run equilibrium.
E) None of these answers is correct.
, output as , and the depreciation rate as
And if
, the economy is:
A) contracting.
B) growing.
C) at the steady state.
D) in its short-run equilibrium.
E) None of these answers is correct.
Question
Refer to the following figure when answering the following questions.
Figure 5.1: Solow Diagram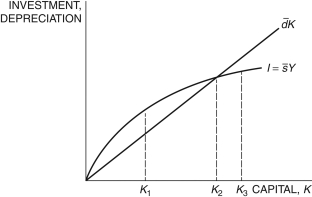
In Figure 5.1, if the economy begins with the initial capital stock at K3, the capital stock will ________ and the economy will ________.
A) increase; grow
B) decrease; shrink
C) stay constant; be in its steady state
D) decrease; be in its steady state
E) stay constant; shrink
Question
Question
In the Solow model, investment, It, as a function of saving,  , and output,
, is written as:
A)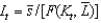 .
.
B) .
.
C)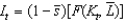 .
.
D) .
.
E) .
.
, and output, , is written as:
A)
.B)
.C)
.D)
.E)
. Question
Question
Refer to the following figure when answering the following questions.
Figure 5.1: Solow Diagram
In Figure 5.1, if the economy begins with the initial capital stock at K2, the capital stock will ________ and the economy will ________.
A) decrease; grow
B) increase; grow
C) stay constant; be in its steady state
D) stay constant; shrink
E) stay constant; grow
Figure 5.1: Solow Diagram
In Figure 5.1, if the economy begins with the initial capital stock at K2, the capital stock will ________ and the economy will ________.
A) decrease; grow
B) increase; grow
C) stay constant; be in its steady state
D) stay constant; shrink
E) stay constant; grow
Question
Refer to the following figure when answering the following questions.
Figure 5.1: Solow Diagram
In Figure 5.1, the capital stock at K1 is not the steady state because:
A) the saving rate is too low.
B) the saving rate is too high.
C) the depreciation rate is too low.
D) gross investment is higher than capital depreciation.
E) gross investment is lower than capital depreciation.
Question
Question
Question
Refer to the following figure when answering the following questions.
Figure 5.1: Solow Diagram
In Figure 5.1, if the economy begins with the initial capital stock at K1, the capital stock will ________ and the economy will ________.
A) decrease; grow
B) increase; grow
C) stay constant; shrink
D) decrease; shrink
E) stay constant; grow
Figure 5.1: Solow Diagram
In Figure 5.1, if the economy begins with the initial capital stock at K1, the capital stock will ________ and the economy will ________.
A) decrease; grow
B) increase; grow
C) stay constant; shrink
D) decrease; shrink
E) stay constant; grow
Question
The equation  is called:
A) saving.
B) investment.
C) net investment.
D) the capital stock.
E) depreciation.
is called:A) saving.
B) investment.
C) net investment.
D) the capital stock.
E) depreciation.
Question
Question
A change in the capital stock, Kt, can be expressed as a function of the saving rate,  ; output,
; the capital stock, Kt ; and the depreciation rate,
, by:
A)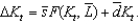
B)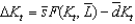 .
.
C)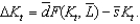
D)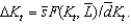
E)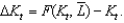
; output, ; the capital stock, Kt ; and the depreciation rate,
, by:
A)
B)
.C)
D)
E)
Question
Refer to the following figure when answering the following questions.
Figure 5.1: Solow Diagram
In Figure 5.1, at K1, net investment is ________ and the economy ________.
A) negative; will grow
B) positive; is in its steady state
C) zero; is in its steady state
D) positive; will grow
E) negative; will contract
Figure 5.1: Solow Diagram
In Figure 5.1, at K1, net investment is ________ and the economy ________.
A) negative; will grow
B) positive; is in its steady state
C) zero; is in its steady state
D) positive; will grow
E) negative; will contract
Question
Question
Question
Assume a production function is given by  . If
. If 
And
, and the steady-state capital stock is 8.0, the steady-state level of output is about:
A) 8.0.
B) 4.0.
C) 45.4.
D) 2.0.
E) 22.6.
. If And
, and the steady-state capital stock is 8.0, the steady-state level of output is about:
A) 8.0.
B) 4.0.
C) 45.4.
D) 2.0.
E) 22.6.
Question
Question
Refer to the following figure when answering the following questions.
Figure 5.3: Solow Diagram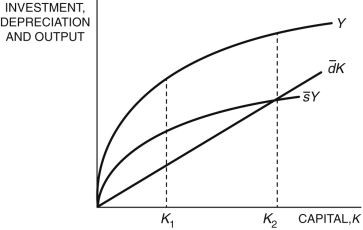
In Figure 5.3, at K2, capital accumulation is ________, the economy is ________, and consumption is ________.
A) positive; growing; positive
B) zero; in the steady state; zero
C) negative; growing; positive
D) zero; in the steady state; positive
E) zero; contracting; negative
Question
The steady-state level of output per worker in the Solow model, with the production function  , is given by:
A) .
.
B)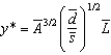 .
.
C)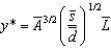 .
.
D)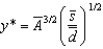 .
.
E) .
.
, is given by:A)
.B)
.C)
.D)
.E)
. Question
Question
Question
Refer to the following figure when answering the following questions.
Figure 5.3: Solow Diagram
In Figure 5.3, at K1, the difference between and
and 
Is ________, and the difference between Y and
Is ________.
A) output; investment
B) net investment; consumption
C) gross investment; consumption
D) output; consumption
E) depreciation; gross investment
Figure 5.3: Solow Diagram
In Figure 5.3, at K1, the difference between
and Is ________, and the difference between Y and
Is ________.
A) output; investment
B) net investment; consumption
C) gross investment; consumption
D) output; consumption
E) depreciation; gross investment
Question
Assume a production function is given by  . If
. If 
, the depreciation rate is
, and the saving rate is
The steady-state level of capital is about:
A) 0.3.
B) 1.3.
C) 2.8.
D) 0.8.
E) 1.6.
. If , the depreciation rate is
, and the saving rate is
The steady-state level of capital is about:
A) 0.3.
B) 1.3.
C) 2.8.
D) 0.8.
E) 1.6.
Question
Assume a production function is given by  . If
. If 
And
, the depreciation rate is
, and the saving rate is
, the steady-state level of capital is about:
A) 0.1.
B) 2.5.
C) 1.6.
D) 8.0.
E) 0.6.
. If And
, the depreciation rate is
, and the saving rate is
, the steady-state level of capital is about:
A) 0.1.
B) 2.5.
C) 1.6.
D) 8.0.
E) 0.6.
Question
Question
Question
Question
Question
Question
Question
Question
Question
If the production function is given by  , the saving rate, s, is 20 percent; the depreciation rate,
, is 10 percent; and
, the steady-state level of output is:
A) 1.4.
B) 4.0.
C) 2.0.
D) 8.0.
E) 3.5.
, the saving rate, s, is 20 percent; the depreciation rate, , is 10 percent; and
, the steady-state level of output is:
A) 1.4.
B) 4.0.
C) 2.0.
D) 8.0.
E) 3.5.
Question
Question
Question
Question
Refer to the following figure when answering the following questions.
Figure 5.4: Solow Diagram
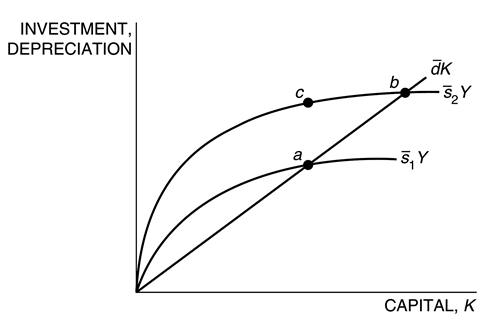
-Consider the Solow model exhibited in Figure 5.4. Which of the following is/are true?
i. For any single country, the movement from point a to b is due to an increase in the saving Rate, s1 s2.
ii. For any single country, the movement from point c to b is due to an increase in capital Stock for the saving rate, s2.
iii. If s1 and s2 stand for the saving rates in Countries 1 and 2, respectively, Country 2 has a Lower saving rate.
A) i
B) ii
C) iii
D) i and ii
E) i, ii, and iii
Figure 5.4: Solow Diagram
-Consider the Solow model exhibited in Figure 5.4. Which of the following is/are true?
i. For any single country, the movement from point a to b is due to an increase in the saving Rate, s1 s2.
ii. For any single country, the movement from point c to b is due to an increase in capital Stock for the saving rate, s2.
iii. If s1 and s2 stand for the saving rates in Countries 1 and 2, respectively, Country 2 has a Lower saving rate.
A) i
B) ii
C) iii
D) i and ii
E) i, ii, and iii
Question
Question
Question
Refer to the following figure when answering the following questions.
Figure 5.4: Solow Diagram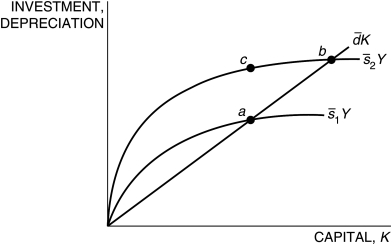
Figure 5.4 represents two countries, 1 and 2. Country ________ has a higher saving rate and will have a ________ steady state than the other country.
A) 2; lower
B) 1; higher
C) 2; higher
D) 1; lower
E) Not enough information is given.
Figure 5.4: Solow Diagram
Figure 5.4 represents two countries, 1 and 2. Country ________ has a higher saving rate and will have a ________ steady state than the other country.
A) 2; lower
B) 1; higher
C) 2; higher
D) 1; lower
E) Not enough information is given.
Question
Refer to the following figure when answering the following questions.
Figure 5.5: Solow Diagram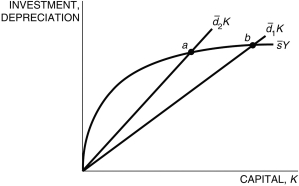
Consider the Solow model exhibited in Figure 5.5. Which of the following is/are true?
i. If 1 denotes Country 1 and 2 denotes Country 2, Country 1 has a higher saving rate.
ii. If 1 denotes Country 1 and 2 denotes Country 2, Country 1 has a lower depreciation rate.
iii. If 1 denotes Country 1 and 2 denotes Country 2, Country 2 has a lower steady state.
A) i
B) ii
C) iii
D) ii and iii
E) i, ii, and iii
Question
Refer to the following figure when answering the following questions.
Figure 5.5: Solow Diagram
Figure 5.5 represents two countries, 1 and 2. Country ________ has a higher depreciation rate and, therefore, has a ________ steady state than the other country.
A) 1; higher
B) 1; lower
C) 2; higher
D) 2; lower
E) Not enough information is given.
Figure 5.5: Solow Diagram
Figure 5.5 represents two countries, 1 and 2. Country ________ has a higher depreciation rate and, therefore, has a ________ steady state than the other country.
A) 1; higher
B) 1; lower
C) 2; higher
D) 2; lower
E) Not enough information is given.
Question
Question
Question
Question
Question
If we define  and
and 
As the saving rates in Countries 1 and 2, respectively,
As the depreciation rates in Countries 1 and 2, respectively, and
And
As productivity in Countries 1 and 2, respectively, in the Solow model, the equation ________ predicts that ________ differences contribute the most to differences in steady-state output per worker.
A) ; productivity
B) ; saving rate
C)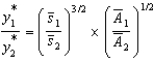 ; productivity
D)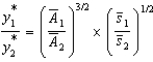 ; productivity
E) ; saving rate
and As the saving rates in Countries 1 and 2, respectively,
As the depreciation rates in Countries 1 and 2, respectively, and
And
As productivity in Countries 1 and 2, respectively, in the Solow model, the equation ________ predicts that ________ differences contribute the most to differences in steady-state output per worker.
A)
; productivityB)
; saving rateC)
; productivityD)
; productivityE)
; saving rate Question
If we define  and
and 
As the saving rates,
As the depreciation rates, and
And
As productivity in Countries 1 and 2, respectively, and the production function per capita is given by
In both countries, the Solow model predicts that the ratio of GDP per worker in Country 1 relative to Country 2 is:
A)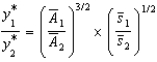 .
.
B)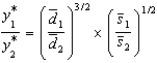 .
.
C)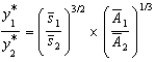 .
.
D) .
.
E) .
.
and As the saving rates,
As the depreciation rates, and
And
As productivity in Countries 1 and 2, respectively, and the production function per capita is given by
In both countries, the Solow model predicts that the ratio of GDP per worker in Country 1 relative to Country 2 is:
A)
.B)
.C)
.D)
.E)
. Question
Question
Question
Question
Question
Refer to the following figure when answering the following questions.
Figure 5.4: Solow Diagram
Consider the Solow model exhibited in Figure 5.4. If a country's saving rate increases from s1 to s2, the economy would:
A) move from point a to point b.
B) move from point c to point a.
C) move from point c to point b.
D) move from point a to point c.
E) stay at point b.
Figure 5.4: Solow Diagram
Consider the Solow model exhibited in Figure 5.4. If a country's saving rate increases from s1 to s2, the economy would:
A) move from point a to point b.
B) move from point c to point a.
C) move from point c to point b.
D) move from point a to point c.
E) stay at point b.
Question
Question

Unlock Deck
Sign up to unlock the cards in this deck!
Unlock Deck
Unlock Deck
1/126
Play
Full screen (f)
Deck 5: The Solow Growth Model
1
In the Solow model, if , the capital stock:
A) declines.
B) stays the same.
C) grows.
D) Not enough information is given.
E) None of these answers is correct.
, the capital stock:A) declines.
B) stays the same.
C) grows.
D) Not enough information is given.
E) None of these answers is correct.
grows.
2
In 2014, the Philippines per capita GDP was about ________, while in South Korea it was ________.
A) $6,600; over $35,000
B) $10,000; $15,000
C) half that of the United States; twice that of the United States
D) $1,000; $2,000
E) $35,000; the same
A) $6,600; over $35,000
B) $10,000; $15,000
C) half that of the United States; twice that of the United States
D) $1,000; $2,000
E) $35,000; the same
$6,600; over $35,000
3
In the Solow model, it is assumed that a(n) ________ fraction of capital depreciates regardless of the capital stock.
A) increasing
B) constant
C) decreasing
D) undetermined
E) None of these answers is correct.
A) increasing
B) constant
C) decreasing
D) undetermined
E) None of these answers is correct.
constant
4
The Solow model of economic growth:
A) endogenizes labor.
B) endogenizes physical capital.
C) exogenizes physical capital.
D) exogenizes investment.
E) endogenizes investment.
A) endogenizes labor.
B) endogenizes physical capital.
C) exogenizes physical capital.
D) exogenizes investment.
E) endogenizes investment.
Unlock Deck
Unlock for access to all 126 flashcards in this deck.
Unlock Deck
k this deck
5
The key insight in the Solow model is that:
A) saving rates are determined in a particular manner.
B) savings have no impact on economic growth.
C) capital depreciation enhances economic growth.
D) the relationship between capital and output is static.
E) capital accumulation contributes to economic growth.
A) saving rates are determined in a particular manner.
B) savings have no impact on economic growth.
C) capital depreciation enhances economic growth.
D) the relationship between capital and output is static.
E) capital accumulation contributes to economic growth.
Unlock Deck
Unlock for access to all 126 flashcards in this deck.
Unlock Deck
k this deck
6
In the Solow model, the parameter denotes ________ and is ________.
A) investment; less than one
B) the depreciation rate; equal to zero
C) consumption; greater than one
D) the depreciation rate; less than one
E) investment; greater than one
denotes ________ and is ________.A) investment; less than one
B) the depreciation rate; equal to zero
C) consumption; greater than one
D) the depreciation rate; less than one
E) investment; greater than one
Unlock Deck
Unlock for access to all 126 flashcards in this deck.
Unlock Deck
k this deck
7
The Solow model describes:
A) how saving rates are determined.
B) the static relationship between capital and output.
C) how savings, population growth, and technological change affect output over time.
D) how savings, population growth, and technological change affect output in a single period.
E) what constitutes technological change.
Unlock Deck
Unlock for access to all 126 flashcards in this deck.
Unlock Deck
k this deck
8
In the corn farm example, saving some of the corn produced:
A) future output, which grows over time.
B) lower consumption in the future.
C) future output, which declines over time.
D) higher consumption today.
E) technological change.
A) future output, which grows over time.
B) lower consumption in the future.
C) future output, which declines over time.
D) higher consumption today.
E) technological change.
Unlock Deck
Unlock for access to all 126 flashcards in this deck.
Unlock Deck
k this deck
9
In the Solow model, in every period, a fraction of total output ________, which ________ next period's capital stock.
A) is saved; reduces
B) depreciates; adds to
C) is saved; adds to
D) is consumed; adds to
E) is consumed; reduces
A) is saved; reduces
B) depreciates; adds to
C) is saved; adds to
D) is consumed; adds to
E) is consumed; reduces
Unlock Deck
Unlock for access to all 126 flashcards in this deck.
Unlock Deck
k this deck
10
In the Solow model, the equation of capital accumulation is:
A) .
B) .
C) .
D) .
E) .
A)
.B)
.C)
.D)
.E)
. Unlock Deck
Unlock for access to all 126 flashcards in this deck.
Unlock Deck
k this deck
11
Using the Solow model, if, in time t = 50, the capital stock is K50 =150, investment is I50 = 15, and is the depreciation rate, capital accumulation from period 50 to 51 is:
A) K51 =5.
B) K51 =-15.
C) K51 = 15.
D) K51 = 120.
E) K51 =0.
is the depreciation rate, capital accumulation from period 50 to 51 is:A) K51 =5.
B) K51 =-15.
C) K51 = 15.
D) K51 = 120.
E) K51 =0.
Unlock Deck
Unlock for access to all 126 flashcards in this deck.
Unlock Deck
k this deck
12
Using the Solow model, if, in time t = 0, the initial capital stock is K0 = 100, investment is I0 = 25, and .1 is the depreciation rate, capital accumulation from period 0 to period 1 is:
A) K1 = 35.
B) K1 =-15.
C) K1 = 15.
D) K1 =0.
E) K1 = 115.
.1 is the depreciation rate, capital accumulation from period 0 to period 1 is:A) K1 = 35.
B) K1 =-15.
C) K1 = 15.
D) K1 =0.
E) K1 = 115.
Unlock Deck
Unlock for access to all 126 flashcards in this deck.
Unlock Deck
k this deck
13
In the Solow model, if investment is ________ depreciation, the capital stock ________.
A) less than; grows
B) greater than; grows
C) greater than; declines
D) equal to; declines
E) equal to; grows
A) less than; grows
B) greater than; grows
C) greater than; declines
D) equal to; declines
E) equal to; grows
Unlock Deck
Unlock for access to all 126 flashcards in this deck.
Unlock Deck
k this deck
14
In 1960, the Philippines had a per capita income ________ South Korea's. In 2014, ________.
A) lower than; this situation had reversed
B) lower than; per capita income was equal in both countries
C) equal to; South Korea had higher per capita income
D) higher than; this situation had reversed
E) higher than; this difference was even more pronounced
A) lower than; this situation had reversed
B) lower than; per capita income was equal in both countries
C) equal to; South Korea had higher per capita income
D) higher than; this situation had reversed
E) higher than; this difference was even more pronounced
Unlock Deck
Unlock for access to all 126 flashcards in this deck.
Unlock Deck
k this deck
15
In the corn farm example, corn can be used as:
A) only investment.
B) either saving or depreciation.
C) only consumption.
D) either consumption or investment.
E) tax revenue.
A) only investment.
B) either saving or depreciation.
C) only consumption.
D) either consumption or investment.
E) tax revenue.
Unlock Deck
Unlock for access to all 126 flashcards in this deck.
Unlock Deck
k this deck
16
If Ct denotes consumption, It denotes investment, and Yt is output, the resource constraint in the Solow model is:
A) Yt = Ct -It.
B) .
C) .
D) .
E) None of these answers is correct.
A) Yt = Ct -It.
B)
.C)
.D)
.E) None of these answers is correct.
Unlock Deck
Unlock for access to all 126 flashcards in this deck.
Unlock Deck
k this deck
17
In the Solow model, defining as the saving rate, Yt as output, and Ct as consumption, investment It is given by:
A) .
B) .
C) .
D) .
E) .
as the saving rate, Yt as output, and Ct as consumption, investment It is given by:A)
.B)
.C)
.D)
.E)
. Unlock Deck
Unlock for access to all 126 flashcards in this deck.
Unlock Deck
k this deck
18
In the simple Solow model, we assume:
A) the depreciation rate is negative.
B) net investment is always positive.
C) TFP equals one.
D) labor is exogenous.
E) the saving rate changes frequently.
A) the depreciation rate is negative.
B) net investment is always positive.
C) TFP equals one.
D) labor is exogenous.
E) the saving rate changes frequently.
Unlock Deck
Unlock for access to all 126 flashcards in this deck.
Unlock Deck
k this deck
19
In the Solow model, defining as the saving rate, Yt as output, and It as investment, consumption is given by:
A) .
B) .
C) .
D) .
E) .
as the saving rate, Yt as output, and It as investment, consumption is given by:A)
.B)
.C)
.D)
.E)
. Unlock Deck
Unlock for access to all 126 flashcards in this deck.
Unlock Deck
k this deck
20
The production function used in the Solow model is:
A) .
B) .
C) .
D) .
E) .
A)
.B)
.C)
.D)
.E)
. Unlock Deck
Unlock for access to all 126 flashcards in this deck.
Unlock Deck
k this deck
21
In the Solow model, if net investment is positive:
A) capital accumulation is zero.
B) capital accumulation is negative.
C) capital accumulation is positive.
D) savings are negative.
E) Not enough information is given.
A) capital accumulation is zero.
B) capital accumulation is negative.
C) capital accumulation is positive.
D) savings are negative.
E) Not enough information is given.
Unlock Deck
Unlock for access to all 126 flashcards in this deck.
Unlock Deck
k this deck
22
If we define the saving rate as , output as
, and the depreciation rate as
And if
, the economy is:
A) contracting.
B) at the steady state.
C) growing.
D) in its short-run equilibrium.
E) None of these answers is correct.
, output as , and the depreciation rate as
And if
, the economy is:
A) contracting.
B) at the steady state.
C) growing.
D) in its short-run equilibrium.
E) None of these answers is correct.
Unlock Deck
Unlock for access to all 126 flashcards in this deck.
Unlock Deck
k this deck
23
The endogenous variables in the Solow model are:
A) the capital stock, labor, and output.
B) consumption, investment, the capital stock, labor, and the saving rate.
C) consumption, investment, the capital stock, labor, and output.
D) productivity and the depreciation and saving rates.
E) the capital stock, labor, output, and the saving rate.
A) the capital stock, labor, and output.
B) consumption, investment, the capital stock, labor, and the saving rate.
C) consumption, investment, the capital stock, labor, and output.
D) productivity and the depreciation and saving rates.
E) the capital stock, labor, output, and the saving rate.
Unlock Deck
Unlock for access to all 126 flashcards in this deck.
Unlock Deck
k this deck
24
Which of the following is an exogenous variable in the Solow model?
A) productivity
B) the depreciation rate
C) the saving rate
D) the initial capital stock
E) All of these answers are correct.
A) productivity
B) the depreciation rate
C) the saving rate
D) the initial capital stock
E) All of these answers are correct.
Unlock Deck
Unlock for access to all 126 flashcards in this deck.
Unlock Deck
k this deck
25
If we define the saving rate as , output as
, and the depreciation rate as
And if
, the economy is:
A) contracting.
B) growing.
C) at the steady state.
D) in its short-run equilibrium.
E) None of these answers is correct.
, output as , and the depreciation rate as
And if
, the economy is:
A) contracting.
B) growing.
C) at the steady state.
D) in its short-run equilibrium.
E) None of these answers is correct.
Unlock Deck
Unlock for access to all 126 flashcards in this deck.
Unlock Deck
k this deck
26
Refer to the following figure when answering the following questions.
Figure 5.1: Solow Diagram
In Figure 5.1, if the economy begins with the initial capital stock at K3, the capital stock will ________ and the economy will ________.
A) increase; grow
B) decrease; shrink
C) stay constant; be in its steady state
D) decrease; be in its steady state
E) stay constant; shrink
Unlock Deck
Unlock for access to all 126 flashcards in this deck.
Unlock Deck
k this deck
27
The Solow model assumes the:
A) capital stock is constant.
B) number of workers is growing.
C) number of workers is constant.
D) saving rate changes each period.
E) depreciation rate changes each period.
A) capital stock is constant.
B) number of workers is growing.
C) number of workers is constant.
D) saving rate changes each period.
E) depreciation rate changes each period.
Unlock Deck
Unlock for access to all 126 flashcards in this deck.
Unlock Deck
k this deck
28
In the Solow model, investment, It, as a function of saving, , and output,
, is written as:
A) .
B) .
C) .
D) .
E) .
, and output, , is written as:
A)
.B)
.C)
.D)
.E)
. Unlock Deck
Unlock for access to all 126 flashcards in this deck.
Unlock Deck
k this deck
29
The Solow model assumes the saving rate is:
A) zero.
B) constant.
C) decreasing as income increases.
D) increasing as income increases.
E) larger as the interest rate rises.
A) zero.
B) constant.
C) decreasing as income increases.
D) increasing as income increases.
E) larger as the interest rate rises.
Unlock Deck
Unlock for access to all 126 flashcards in this deck.
Unlock Deck
k this deck
30
Refer to the following figure when answering the following questions.
Figure 5.1: Solow Diagram
In Figure 5.1, if the economy begins with the initial capital stock at K2, the capital stock will ________ and the economy will ________.
A) decrease; grow
B) increase; grow
C) stay constant; be in its steady state
D) stay constant; shrink
E) stay constant; grow
Figure 5.1: Solow Diagram
In Figure 5.1, if the economy begins with the initial capital stock at K2, the capital stock will ________ and the economy will ________.
A) decrease; grow
B) increase; grow
C) stay constant; be in its steady state
D) stay constant; shrink
E) stay constant; grow
Unlock Deck
Unlock for access to all 126 flashcards in this deck.
Unlock Deck
k this deck
31
Refer to the following figure when answering the following questions.
Figure 5.1: Solow Diagram
In Figure 5.1, the capital stock at K1 is not the steady state because:
A) the saving rate is too low.
B) the saving rate is too high.
C) the depreciation rate is too low.
D) gross investment is higher than capital depreciation.
E) gross investment is lower than capital depreciation.
Unlock Deck
Unlock for access to all 126 flashcards in this deck.
Unlock Deck
k this deck
32
Capital accumulation is a(n):
A) stock.
B) flow.
C) final good.
D) intermediate good.
E) None of these answers is correct.
A) stock.
B) flow.
C) final good.
D) intermediate good.
E) None of these answers is correct.
Unlock Deck
Unlock for access to all 126 flashcards in this deck.
Unlock Deck
k this deck
33
The amount of capital in an economy is a(n) ________, while the amount of investment is a(n) ________.
A) flow; stock
B) stock; flow
C) final good; intermediate good
D) intermediate good; final good
E) None of these answers is correct.
A) flow; stock
B) stock; flow
C) final good; intermediate good
D) intermediate good; final good
E) None of these answers is correct.
Unlock Deck
Unlock for access to all 126 flashcards in this deck.
Unlock Deck
k this deck
34
Refer to the following figure when answering the following questions.
Figure 5.1: Solow Diagram
In Figure 5.1, if the economy begins with the initial capital stock at K1, the capital stock will ________ and the economy will ________.
A) decrease; grow
B) increase; grow
C) stay constant; shrink
D) decrease; shrink
E) stay constant; grow
Figure 5.1: Solow Diagram
In Figure 5.1, if the economy begins with the initial capital stock at K1, the capital stock will ________ and the economy will ________.
A) decrease; grow
B) increase; grow
C) stay constant; shrink
D) decrease; shrink
E) stay constant; grow
Unlock Deck
Unlock for access to all 126 flashcards in this deck.
Unlock Deck
k this deck
35
The equation is called:
A) saving.
B) investment.
C) net investment.
D) the capital stock.
E) depreciation.
is called:A) saving.
B) investment.
C) net investment.
D) the capital stock.
E) depreciation.
Unlock Deck
Unlock for access to all 126 flashcards in this deck.
Unlock Deck
k this deck
36
The steady state is defined as the point where capital accumulation, Kt, is equal to:
A) the saving rate.
B) zero.
C) the depreciation rate.
D) the productivity growth rate.
E) the population growth rate.
A) the saving rate.
B) zero.
C) the depreciation rate.
D) the productivity growth rate.
E) the population growth rate.
Unlock Deck
Unlock for access to all 126 flashcards in this deck.
Unlock Deck
k this deck
37
A change in the capital stock, Kt, can be expressed as a function of the saving rate, ; output,
; the capital stock, Kt ; and the depreciation rate,
, by:
A)
B) .
C)
D)
E)
; output, ; the capital stock, Kt ; and the depreciation rate,
, by:
A)
B)
.C)
D)
E)
Unlock Deck
Unlock for access to all 126 flashcards in this deck.
Unlock Deck
k this deck
38
Refer to the following figure when answering the following questions.
Figure 5.1: Solow Diagram
In Figure 5.1, at K1, net investment is ________ and the economy ________.
A) negative; will grow
B) positive; is in its steady state
C) zero; is in its steady state
D) positive; will grow
E) negative; will contract
Figure 5.1: Solow Diagram
In Figure 5.1, at K1, net investment is ________ and the economy ________.
A) negative; will grow
B) positive; is in its steady state
C) zero; is in its steady state
D) positive; will grow
E) negative; will contract
Unlock Deck
Unlock for access to all 126 flashcards in this deck.
Unlock Deck
k this deck
39
Which of the following is/are left out of the Solow model?
A) productivity
B) consumption
C) real interest rates
D) the saving rate
E) depreciation
A) productivity
B) consumption
C) real interest rates
D) the saving rate
E) depreciation
Unlock Deck
Unlock for access to all 126 flashcards in this deck.
Unlock Deck
k this deck
40
In the Solow model, net investment is defined as:
A) investment plus capital depreciation.
B) investment minus capital depreciation.
C) the saving rate minus the depreciation rate.
D) the saving rate plus the depreciation rate.
E) None of these answers is correct.
A) investment plus capital depreciation.
B) investment minus capital depreciation.
C) the saving rate minus the depreciation rate.
D) the saving rate plus the depreciation rate.
E) None of these answers is correct.
Unlock Deck
Unlock for access to all 126 flashcards in this deck.
Unlock Deck
k this deck
41
Assume a production function is given by . If
And
, and the steady-state capital stock is 8.0, the steady-state level of output is about:
A) 8.0.
B) 4.0.
C) 45.4.
D) 2.0.
E) 22.6.
. If And
, and the steady-state capital stock is 8.0, the steady-state level of output is about:
A) 8.0.
B) 4.0.
C) 45.4.
D) 2.0.
E) 22.6.
Unlock Deck
Unlock for access to all 126 flashcards in this deck.
Unlock Deck
k this deck
42
An increase in ________ leads to a higher steady-state level of output per worker, and a decline in the ________ leads to a lower steady-state level of output per worker.
A) productivity; saving rate
B) the saving rate; initial capital stock
C) the saving rate; depreciation rate
D) the initial capital stock; saving rate
E) None of these answers is correct.
A) productivity; saving rate
B) the saving rate; initial capital stock
C) the saving rate; depreciation rate
D) the initial capital stock; saving rate
E) None of these answers is correct.
Unlock Deck
Unlock for access to all 126 flashcards in this deck.
Unlock Deck
k this deck
43
Refer to the following figure when answering the following questions.
Figure 5.3: Solow Diagram
In Figure 5.3, at K2, capital accumulation is ________, the economy is ________, and consumption is ________.
A) positive; growing; positive
B) zero; in the steady state; zero
C) negative; growing; positive
D) zero; in the steady state; positive
E) zero; contracting; negative
Unlock Deck
Unlock for access to all 126 flashcards in this deck.
Unlock Deck
k this deck
44
The steady-state level of output per worker in the Solow model, with the production function , is given by:
A) .
B) .
C) .
D) .
E) .
, is given by:A)
.B)
.C)
.D)
.E)
. Unlock Deck
Unlock for access to all 126 flashcards in this deck.
Unlock Deck
k this deck
45
In the standard production model's production function, the productivity parameter enters the equation with an exponent of one, while in the Solow model's equation for the steady-state stock of capital it is greater than one because:
A) the endogenous level of the capital stock itself depends on productivity.
B) there is no productivity parameter in the production function model.
C) the productivity measure is zero in the production function model.
D) the productivity measure is negative in the Solow model.
E) the exogenous level of the capital stock itself depends on productivity.
Unlock Deck
Unlock for access to all 126 flashcards in this deck.
Unlock Deck
k this deck
46
In the Solow model, if capital is in the steady state, output:
A) will continue to grow.
B) is also in the steady state.
C) will continue to grow, but its rate of growth will slow down.
D) will decline, but its rate of growth will be positive.
E) will begin to contract.
A) will continue to grow.
B) is also in the steady state.
C) will continue to grow, but its rate of growth will slow down.
D) will decline, but its rate of growth will be positive.
E) will begin to contract.
Unlock Deck
Unlock for access to all 126 flashcards in this deck.
Unlock Deck
k this deck
47
Refer to the following figure when answering the following questions.
Figure 5.3: Solow Diagram
In Figure 5.3, at K1, the difference between and
Is ________, and the difference between Y and
Is ________.
A) output; investment
B) net investment; consumption
C) gross investment; consumption
D) output; consumption
E) depreciation; gross investment
Figure 5.3: Solow Diagram
In Figure 5.3, at K1, the difference between
and Is ________, and the difference between Y and
Is ________.
A) output; investment
B) net investment; consumption
C) gross investment; consumption
D) output; consumption
E) depreciation; gross investment
Unlock Deck
Unlock for access to all 126 flashcards in this deck.
Unlock Deck
k this deck
48
Assume a production function is given by . If
, the depreciation rate is
, and the saving rate is
The steady-state level of capital is about:
A) 0.3.
B) 1.3.
C) 2.8.
D) 0.8.
E) 1.6.
. If , the depreciation rate is
, and the saving rate is
The steady-state level of capital is about:
A) 0.3.
B) 1.3.
C) 2.8.
D) 0.8.
E) 1.6.
Unlock Deck
Unlock for access to all 126 flashcards in this deck.
Unlock Deck
k this deck
49
Assume a production function is given by . If
And
, the depreciation rate is
, and the saving rate is
, the steady-state level of capital is about:
A) 0.1.
B) 2.5.
C) 1.6.
D) 8.0.
E) 0.6.
. If And
, the depreciation rate is
, and the saving rate is
, the steady-state level of capital is about:
A) 0.1.
B) 2.5.
C) 1.6.
D) 8.0.
E) 0.6.
Unlock Deck
Unlock for access to all 126 flashcards in this deck.
Unlock Deck
k this deck
50
According to the Solow model, in the steady state, countries with high saving rates should have a:
A) low labor-output ratio.
B) low capital-output ratio.
C) high capital-output ratio.
D) high depreciation rate.
E) high A.
A) low labor-output ratio.
B) low capital-output ratio.
C) high capital-output ratio.
D) high depreciation rate.
E) high A.
Unlock Deck
Unlock for access to all 126 flashcards in this deck.
Unlock Deck
k this deck
51
In the Solow model, it is assumed a(n) ________ fraction of capital depreciates each period.
A) zero
B) increasing
C) decreasing
D) constant
E) None of these answers is correct.
A) zero
B) increasing
C) decreasing
D) constant
E) None of these answers is correct.
Unlock Deck
Unlock for access to all 126 flashcards in this deck.
Unlock Deck
k this deck
52
Over the past 30 years, ________ has averaged a saving rate of ________ percent.
A) Japan; 15
B) Russia; 5
C) the United States; 15
D) South Korea; 35
E) China; 12.5
A) Japan; 15
B) Russia; 5
C) the United States; 15
D) South Korea; 35
E) China; 12.5
Unlock Deck
Unlock for access to all 126 flashcards in this deck.
Unlock Deck
k this deck
53
An increase in ________ leads to a higher steady-state level of output, and an increase in ________ leads to a lower steady-state level of output.
A) the saving rate; the depreciation rate
B) the saving rate; productivity
C) productivity; the initial capital stock
D) the depreciation rate; the labor stock
E) None of these answers is correct.
A) the saving rate; the depreciation rate
B) the saving rate; productivity
C) productivity; the initial capital stock
D) the depreciation rate; the labor stock
E) None of these answers is correct.
Unlock Deck
Unlock for access to all 126 flashcards in this deck.
Unlock Deck
k this deck
54
The key difference between the Solow model and the production model is that the:
A) Solow model endogenizes the process of capital accumulation.
B) production function model endogenizes the process of capital accumulation.
C) Solow model uses different values for the capital share.
D) Solow model does not contain a productivity measure.
E) Solow model exogenizes the process of capital accumulation.
Unlock Deck
Unlock for access to all 126 flashcards in this deck.
Unlock Deck
k this deck
55
An increase in ________ leads to a higher steady-state capital stock, and a decline in ________ leads to a lower steady-state capital stock.
A) the saving rate; the depreciation rate
B) the saving rate; productivity
C) productivity; the initial capital stock
D) the depreciation rate; the labor stock
E) None of these answers is correct.
A) the saving rate; the depreciation rate
B) the saving rate; productivity
C) productivity; the initial capital stock
D) the depreciation rate; the labor stock
E) None of these answers is correct.
Unlock Deck
Unlock for access to all 126 flashcards in this deck.
Unlock Deck
k this deck
56
Over the past 30 years, ________ has averaged a saving rate of ________ percent.
A) Japan; 15
B) Russia; 5
C) the United States; 25
D) South Korea; 45
E) China; 12.5
A) Japan; 15
B) Russia; 5
C) the United States; 25
D) South Korea; 45
E) China; 12.5
Unlock Deck
Unlock for access to all 126 flashcards in this deck.
Unlock Deck
k this deck
57
In the Solow model, the ________ plays a ________ role than it does in the standard production function model.
A) labor supply; larger
B) productivity parameter; larger
C) capital stock; larger
D) capital stock; smaller
E) productivity parameter; smaller
A) labor supply; larger
B) productivity parameter; larger
C) capital stock; larger
D) capital stock; smaller
E) productivity parameter; smaller
Unlock Deck
Unlock for access to all 126 flashcards in this deck.
Unlock Deck
k this deck
58
If the production function is given by , the saving rate, s, is 20 percent; the depreciation rate,
, is 10 percent; and
, the steady-state level of output is:
A) 1.4.
B) 4.0.
C) 2.0.
D) 8.0.
E) 3.5.
, the saving rate, s, is 20 percent; the depreciation rate, , is 10 percent; and
, the steady-state level of output is:
A) 1.4.
B) 4.0.
C) 2.0.
D) 8.0.
E) 3.5.
Unlock Deck
Unlock for access to all 126 flashcards in this deck.
Unlock Deck
k this deck
59
If a natural disaster destroys a large portion of a country's capital stock but the saving and depreciation rates are unchanged, the Solow model predicts that the economy will grow and eventually reach:
A) the same steady-state level of output as it would have before the disaster.
B) a higher steady-state level of output than it would have before the disaster.
C) a lower steady-state level of output than it would have before the disaster.
D) Not enough information is given.
E) None of these answers is correct.
Unlock Deck
Unlock for access to all 126 flashcards in this deck.
Unlock Deck
k this deck
60
In the Solow model, if, in the absence of any shocks, the capital stock remains at K* forever, this rest point is called the:
A) saving rate.
B) short-run equilibrium.
C) steady state.
D) rate of capital accumulation.
E) dynamic system.
A) saving rate.
B) short-run equilibrium.
C) steady state.
D) rate of capital accumulation.
E) dynamic system.
Unlock Deck
Unlock for access to all 126 flashcards in this deck.
Unlock Deck
k this deck
61
An implication of the Solow model is that once an economy reaches the steady state:
A) long-term growth continues indefinitely.
B) long-term growth does not continue.
C) long-term growth accelerates.
D) long-term growth decelerates.
E) None of these answers is correct.
A) long-term growth continues indefinitely.
B) long-term growth does not continue.
C) long-term growth accelerates.
D) long-term growth decelerates.
E) None of these answers is correct.
Unlock Deck
Unlock for access to all 126 flashcards in this deck.
Unlock Deck
k this deck
62
Refer to the following figure when answering the following questions.
Figure 5.4: Solow Diagram
-Consider the Solow model exhibited in Figure 5.4. Which of the following is/are true?
i. For any single country, the movement from point a to b is due to an increase in the saving Rate, s1 s2.
ii. For any single country, the movement from point c to b is due to an increase in capital Stock for the saving rate, s2.
iii. If s1 and s2 stand for the saving rates in Countries 1 and 2, respectively, Country 2 has a Lower saving rate.
A) i
B) ii
C) iii
D) i and ii
E) i, ii, and iii
Unlock Deck
Unlock for access to all 126 flashcards in this deck.
Unlock Deck
k this deck
63
Immediately following the increase in the saving rate, output grows rapidly. As the economy approaches its new steady state, the growth rate:
A) gradually increases.
B) gradually declines.
C) is constant.
D) is negative.
E) None of these answers is correct.
A) gradually increases.
B) gradually declines.
C) is constant.
D) is negative.
E) None of these answers is correct.
Unlock Deck
Unlock for access to all 126 flashcards in this deck.
Unlock Deck
k this deck
64
In the Solow model, saving and investing in additional factories and computers does ________ output to grow in the ________ run if the economy is below Y*. But, in the long run, the ________ returns to capital accumulation lead the return to these investments to fall.
A) lead; medium; diminishing
B) lead; long; increasing
C) lead; medium; increasing
D) not lead; medium; diminishing
E) not lead; long; increasing
A) lead; medium; diminishing
B) lead; long; increasing
C) lead; medium; increasing
D) not lead; medium; diminishing
E) not lead; long; increasing
Unlock Deck
Unlock for access to all 126 flashcards in this deck.
Unlock Deck
k this deck
65
Refer to the following figure when answering the following questions.
Figure 5.4: Solow Diagram
Figure 5.4 represents two countries, 1 and 2. Country ________ has a higher saving rate and will have a ________ steady state than the other country.
A) 2; lower
B) 1; higher
C) 2; higher
D) 1; lower
E) Not enough information is given.
Figure 5.4: Solow Diagram
Figure 5.4 represents two countries, 1 and 2. Country ________ has a higher saving rate and will have a ________ steady state than the other country.
A) 2; lower
B) 1; higher
C) 2; higher
D) 1; lower
E) Not enough information is given.
Unlock Deck
Unlock for access to all 126 flashcards in this deck.
Unlock Deck
k this deck
66
Refer to the following figure when answering the following questions.
Figure 5.5: Solow Diagram
Consider the Solow model exhibited in Figure 5.5. Which of the following is/are true?
i. If 1 denotes Country 1 and 2 denotes Country 2, Country 1 has a higher saving rate.
ii. If 1 denotes Country 1 and 2 denotes Country 2, Country 1 has a lower depreciation rate.
iii. If 1 denotes Country 1 and 2 denotes Country 2, Country 2 has a lower steady state.
A) i
B) ii
C) iii
D) ii and iii
E) i, ii, and iii
Unlock Deck
Unlock for access to all 126 flashcards in this deck.
Unlock Deck
k this deck
67
Refer to the following figure when answering the following questions.
Figure 5.5: Solow Diagram
Figure 5.5 represents two countries, 1 and 2. Country ________ has a higher depreciation rate and, therefore, has a ________ steady state than the other country.
A) 1; higher
B) 1; lower
C) 2; higher
D) 2; lower
E) Not enough information is given.
Figure 5.5: Solow Diagram
Figure 5.5 represents two countries, 1 and 2. Country ________ has a higher depreciation rate and, therefore, has a ________ steady state than the other country.
A) 1; higher
B) 1; lower
C) 2; higher
D) 2; lower
E) Not enough information is given.
Unlock Deck
Unlock for access to all 126 flashcards in this deck.
Unlock Deck
k this deck
68
In the Solow model, with population growth:
A) there is no steady state in output per person.
B) the economy never settles down to a steady state and exhibits growth in output per person.
C) the economy eventually settles down to a steady state in output per person.
D) the economy eventually settles down to a steady state with no growth in aggregate output.
E) None of these answers is correct.
Unlock Deck
Unlock for access to all 126 flashcards in this deck.
Unlock Deck
k this deck
69
Which of the following best answers whether growth in the labor force leads to overall economic growth?
A) Population growth can produce growth in the Solow model in the aggregate but not in output per person.
B) Total capital and production per worker can grow as the population of the economy grows.
C) It never does-only capital contributes to aggregate economic growth.
D) Population growth can produce growth in the Solow model in the aggregate and in output per person.
E) Population growth increases output per person but not aggregate output.
Unlock Deck
Unlock for access to all 126 flashcards in this deck.
Unlock Deck
k this deck
70
A central lesson of the Solow model is that:
A) capital accumulation cannot serve as the engine of long-run per capita economic growth.
B) capital accumulation is the only engine of long-run per capita economic growth.
C) consumption is the only engine of short-run per capita economic growth.
D) saving rates serve as the engine of long-run per capita economic growth.
E) the initial capital stock plays a large part in long-run economic growth.
Unlock Deck
Unlock for access to all 126 flashcards in this deck.
Unlock Deck
k this deck
71
In the Solow model, if a country's saving rate increases, the country:
A) moves from a relatively low steady state to one that is lower.
B) moves from a relatively low steady state to one that is higher.
C) moves from a relatively high steady state to one that is lower.
D) stays at a constant high steady state.
E) stays at a constant low steady state.
A) moves from a relatively low steady state to one that is lower.
B) moves from a relatively low steady state to one that is higher.
C) moves from a relatively high steady state to one that is lower.
D) stays at a constant high steady state.
E) stays at a constant low steady state.
Unlock Deck
Unlock for access to all 126 flashcards in this deck.
Unlock Deck
k this deck
72
If we define and
As the saving rates in Countries 1 and 2, respectively,
As the depreciation rates in Countries 1 and 2, respectively, and
And
As productivity in Countries 1 and 2, respectively, in the Solow model, the equation ________ predicts that ________ differences contribute the most to differences in steady-state output per worker.
A) ; productivity
B) ; saving rate
C) ; productivity
D) ; productivity
E) ; saving rate
and As the saving rates in Countries 1 and 2, respectively,
As the depreciation rates in Countries 1 and 2, respectively, and
And
As productivity in Countries 1 and 2, respectively, in the Solow model, the equation ________ predicts that ________ differences contribute the most to differences in steady-state output per worker.
A)
; productivityB)
; saving rateC)
; productivityD)
; productivityE)
; saving rate Unlock Deck
Unlock for access to all 126 flashcards in this deck.
Unlock Deck
k this deck
73
If we define and
As the saving rates,
As the depreciation rates, and
And
As productivity in Countries 1 and 2, respectively, and the production function per capita is given by
In both countries, the Solow model predicts that the ratio of GDP per worker in Country 1 relative to Country 2 is:
A) .
B) .
C) .
D) .
E) .
and As the saving rates,
As the depreciation rates, and
And
As productivity in Countries 1 and 2, respectively, and the production function per capita is given by
In both countries, the Solow model predicts that the ratio of GDP per worker in Country 1 relative to Country 2 is:
A)
.B)
.C)
.D)
.E)
. Unlock Deck
Unlock for access to all 126 flashcards in this deck.
Unlock Deck
k this deck
74
A decline in the saving rate causes the steady-state level of output:
A) and capital to rise.
B) to rise and capital to fall.
C) and capital to fall.
D) and capital to remain constant.
E) to rise and capital to remain constant.
A) and capital to rise.
B) to rise and capital to fall.
C) and capital to fall.
D) and capital to remain constant.
E) to rise and capital to remain constant.
Unlock Deck
Unlock for access to all 126 flashcards in this deck.
Unlock Deck
k this deck
75
An implication of the Solow model is that once an economy reaches the steady state, per capita:
A) consumption is constant.
B) output is constant, but per capita capital is not.
C) capital is variable.
D) consumption continues to grow.
E) consumption is growing.
A) consumption is constant.
B) output is constant, but per capita capital is not.
C) capital is variable.
D) consumption continues to grow.
E) consumption is growing.
Unlock Deck
Unlock for access to all 126 flashcards in this deck.
Unlock Deck
k this deck
76
If the depreciation and saving rates are constant, the economy eventually will reach the steady state in the Solow model because of:
A) the lack of productivity.
B) increasing returns to capital in production.
C) constant returns to capital in production.
D) diminishing returns to capital in production.
E) increasing returns to labor in production.
A) the lack of productivity.
B) increasing returns to capital in production.
C) constant returns to capital in production.
D) diminishing returns to capital in production.
E) increasing returns to labor in production.
Unlock Deck
Unlock for access to all 126 flashcards in this deck.
Unlock Deck
k this deck
77
Assume two economies are identical in every way except that one has a higher saving rate. According to the Solow growth model, in the steady state, the country with the higher saving rate will have ________ level of total output and ________ rate of growth of output than/as the country with the lower saving rate.
A) a higher; a higher
B) a higher; the same
C) a lower; a higher
D) a higher; a lower
E) the same; the same
A) a higher; a higher
B) a higher; the same
C) a lower; a higher
D) a higher; a lower
E) the same; the same
Unlock Deck
Unlock for access to all 126 flashcards in this deck.
Unlock Deck
k this deck
78
Refer to the following figure when answering the following questions.
Figure 5.4: Solow Diagram
Consider the Solow model exhibited in Figure 5.4. If a country's saving rate increases from s1 to s2, the economy would:
A) move from point a to point b.
B) move from point c to point a.
C) move from point c to point b.
D) move from point a to point c.
E) stay at point b.
Figure 5.4: Solow Diagram
Consider the Solow model exhibited in Figure 5.4. If a country's saving rate increases from s1 to s2, the economy would:
A) move from point a to point b.
B) move from point c to point a.
C) move from point c to point b.
D) move from point a to point c.
E) stay at point b.
Unlock Deck
Unlock for access to all 126 flashcards in this deck.
Unlock Deck
k this deck
79
In the Solow model, if we assume that capital depreciation rates are the same across all countries, differences in per capita output can be explained by:
A) the steady-state capital stock.
B) the initial capital stock and saving rates.
C) differences in productivity and saving rates.
D) the labor stock and saving rates.
E) None of these answers is correct.
A) the steady-state capital stock.
B) the initial capital stock and saving rates.
C) differences in productivity and saving rates.
D) the labor stock and saving rates.
E) None of these answers is correct.
Unlock Deck
Unlock for access to all 126 flashcards in this deck.
Unlock Deck
k this deck
80
Suppose you are given the data for Brazil and Portugal. In Brazil, the saving rate is 0.1 and the depreciation rate is 0.1, while in Portugal the saving rate is 0.2 and the depreciation rate is 0.1. Using the Solow model, you conclude that in the steady state:
A) Brazil has a higher level of output than Portugal.
B) Brazil has a higher capital-output ratio than Portugal.
C) Portugal has a higher level of output than Brazil.
D) Portugal has a higher capital-output ratio than Brazil.
E) Portugal and Brazil have the same capital-output ratio.
A) Brazil has a higher level of output than Portugal.
B) Brazil has a higher capital-output ratio than Portugal.
C) Portugal has a higher level of output than Brazil.
D) Portugal has a higher capital-output ratio than Brazil.
E) Portugal and Brazil have the same capital-output ratio.
Unlock Deck
Unlock for access to all 126 flashcards in this deck.
Unlock Deck
k this deck
Unlock Deck
Unlock for access to all 126 flashcards in this deck.


