Exam 5: The Solow Growth Model
If South Korea's steady-state GDP per worker is higher than that of the Philippines, you might conclude that ________, ceteris paribus.
A
You are asked to make comparisons of two pairs of countries. The first pair is the Latin American countries of Chile and Argentina; the second pair is France and Germany. You are given the following information: the average saving rate in Argentina is 23.3 percent, in Chile it is 28.7 percent, in France it is 21.1 percent, and in Germany it is 20.8 percent. Assuming the countries are identical in every other way, which country would the Solow model predict to have the higher per capita real GDP? However, you find out the steady-state real per capita GDP in each of the countries is $13,300 in Argentina, $12,500 in Chile, $31,300 in France, and $34,000 in Germany. What is the primary factor that the simple Solow model uses to describe these differences? Give an example.
It is easiest to do mathematically. Using equation 5.12, p. 115, we can make the comparison, comparing countries 1 and 2.
Because depreciation rates are identical:  , because
  and
and  . From this it is clear that the model hypothesizes
  .
.
However, the data shows that in fact the per capita RGDP is in Germany. The Solow model uses total factor productivity to explain differences in RPCGDP. The combination of a high TFP with the saving rate implies-according to the Solow model-a higher steady-state level of output. On the other end of the scale, the low saving rate in Argentina, possibly coupled with low TFP, means a relatively low steady-state output. Examples of factors that contribute to TFP include human capital, health, institutions, high levels of peace, and so on.
Refer to the following figure when answering the following questions.
Figure 5.1: Solow Diagram 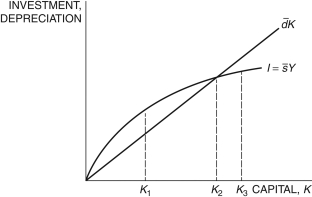 -In Figure 5.1, if the economy begins with the initial capital stock at K1, the capital stock will ________ and the economy will ________.
B
A decline in the saving rate causes the steady-state level of output:
Refer to the following figure when answering the following questions.
Figure 5.1: Solow Diagram
-In Figure 5.1, the capital stock at K1 is not the steady state because:
According to the Solow model, in the steady state, countries with high saving rates should have a:
In the Solow model, if capital is in the steady state, output:
Refer to the following figure when answering the following questions.
Figure 5.7: Solow Diagram 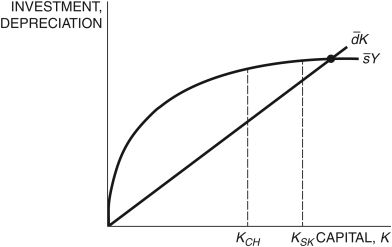 -Consider Figure 5.7. If KSK is the current capital stock in South Korea and KCH is the current capital stock in China, according to the principle of transition dynamics:
If South Korea's steady-state GDP per worker is higher than that in the Philippines, you might conclude that the saving/depreciation rate in South Korea is higher/lower than in the Philippines.
Assume two economies are identical in every way except that one has a higher saving rate. According to the Solow growth model, in the steady state, the country with the higher saving rate will have ________ level of total output and ________ rate of growth of output than/as the country with the lower saving rate.
Refer to the following figure when answering the following questions.
Figure 5.4: Solow Diagram
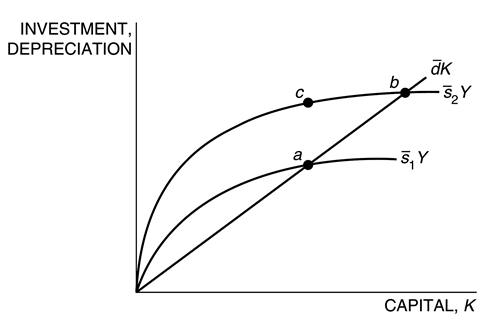 -Consider the Solow model exhibited in Figure 5.4. Which of the following is/are true?
i. For any single country, the movement from point a to b is due to an increase in the saving Rate, s1 s2.
ii. For any single country, the movement from point c to b is due to an increase in capital Stock for the saving rate, s2.
iii. If s1 and s2 stand for the saving rates in Countries 1 and 2, respectively, Country 2 has a Lower saving rate.
-Consider the Solow model exhibited in Figure 5.4. Which of the following is/are true?
i. For any single country, the movement from point a to b is due to an increase in the saving Rate, s1 s2.
ii. For any single country, the movement from point c to b is due to an increase in capital Stock for the saving rate, s2.
iii. If s1 and s2 stand for the saving rates in Countries 1 and 2, respectively, Country 2 has a Lower saving rate.
The steady-state level of output per worker in the Solow model, with the production function  , is given by:
Over the past 30 years, ________ has averaged a saving rate of ________ percent.
In the Solow model, defining  as the saving rate and Yt as output, consumption is given by
  .
.
In the standard production model's production function, the productivity parameter enters the equation with an exponent of one, while in the Solow model's equation for the steady-state stock of capital it is greater than one because:
Immediately following the increase in the saving rate, output grows rapidly. As the economy approaches its new steady state, the growth rate:
On average, if both rich and poor countries grow at the same rate, this suggests that:
In the Solow model, if a country's saving rate increases, the country:
Filters
- Essay(0)
- Multiple Choice(0)
- Short Answer(0)
- True False(0)
- Matching(0)