Deck 18: The Genetic and Environmental Basis of Complex Traits
Full screen (f)
Question
Question
Question
The graph here shows the results of growing one strain of a crop plant in soils with different nitrogen contents. 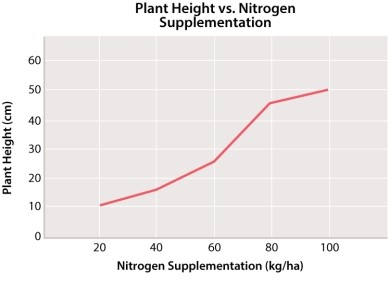 If a different strain of the same plant were grown in the same soils, you would predict that:
A)it would respond the same way to nitrogen supplementation because they are the same plant.
B)it would respond completely differently to nitrogen supplementation because they are different strains.
C)it could respond the same way or differently; different genotypes can, but may not always, respond differently to the same range of environments.
D)it could respond the same way or differently; the environment has too many variables to predict.
E)None of the answer options is correct.
If a different strain of the same plant were grown in the same soils, you would predict that:A)it would respond the same way to nitrogen supplementation because they are the same plant.
B)it would respond completely differently to nitrogen supplementation because they are different strains.
C)it could respond the same way or differently; different genotypes can, but may not always, respond differently to the same range of environments.
D)it could respond the same way or differently; the environment has too many variables to predict.
E)None of the answer options is correct.
Question
The plots shown here depict several possible outcomes of an experiment comparing the mean phenotype of a behavioral trait in two strains of mice in three environments. Strain 1 is represented by filled circles and Strain 2 is represented by open circles. Environment 1 (E1) is deficient in stimulation for the behavior, environment 2 (E2) has an average level of stimulation, and environment 3 (E3) is enriched in stimulation. Which of the possible results indicates the presence of genotype-by-environment interaction for one or both of the strains? 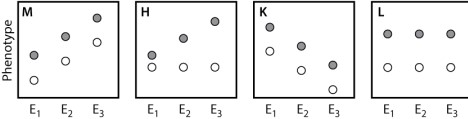
A)result M
B)result H
C)result K
D)result L
E)None of the answer options is correct.
A)result M
B)result H
C)result K
D)result L
E)None of the answer options is correct.
Question
Question
Question
Question
Which of the graphs below would likely represent the distribution of a complex trait? 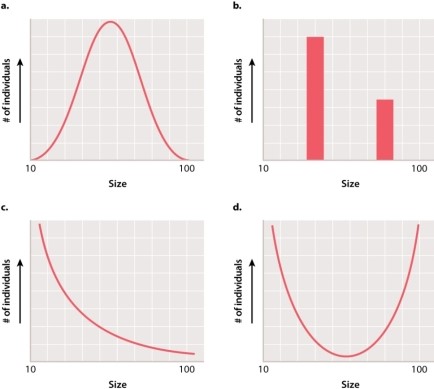
A)graph A
B)graph B
C)graph C
D)graph D
A)graph A
B)graph B
C)graph C
D)graph D
Question
Question
Which of the graphs below would likely represent the distribution of a simple, single gene trait? 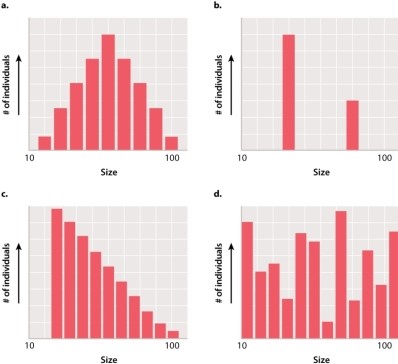
A)graph A
B)graph B
C)graph C
D)graph D
A)graph A
B)graph B
C)graph C
D)graph D
Question
Question
Question
Question
Question
Question
Question
Question
Question
Question
Question
Five varieties of hybrid corn are studied for average yield of corn (the phenotype) as a function of annual rainfall (the environment), with the results shown here. 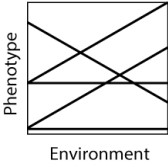 Each of these lines constitutes a:
A)normative assessment.
B)genotype-by-environment interaction.
C)normalizing transformation.
D)normal curve of error.
E)norm of reaction.
Each of these lines constitutes a:A)normative assessment.
B)genotype-by-environment interaction.
C)normalizing transformation.
D)normal curve of error.
E)norm of reaction.
Question
Question
Question
The plots shown here depict several possible outcomes of an experiment comparing the mean phenotype of a behavioral trait in two strains of mice in three environments. Strain 1 is represented by filled circles and Strain 2 is represented by open circles. Environment 1 (E1) is deficient in stimulation for the behavior, environment 2 (E2) has an average level of stimulation, and environment 3 (E3) is enriched in stimulation. Which of the possible results indicates the absence of genotype-by-environment interaction? 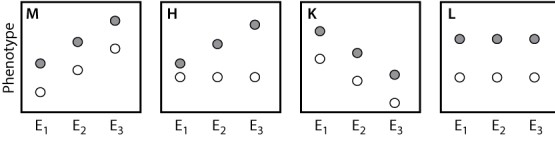
A)result M
B)result H
C)result K
D)result L
E)None of the answer options is correct.
A)result M
B)result H
C)result K
D)result L
E)None of the answer options is correct.
Question
Question
Question
Question
Question
Question
Question
Question
Question
Question
Question
Question
Question
Question
Question
Question
Question
In a parent-offspring regression experiment, suggest a hypothesis that could explain the solid line in the following graph. 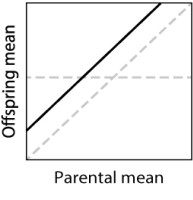
A)The offspring have a "worse" environment than the parents did.
B)The offspring have a "better" environment than the parents did.
C)The trait has a heritability that is less than 0.
D)The trait has a heritability that is greater than 1.
E)None of the answer options is correct.
A)The offspring have a "worse" environment than the parents did.
B)The offspring have a "better" environment than the parents did.
C)The trait has a heritability that is less than 0.
D)The trait has a heritability that is greater than 1.
E)None of the answer options is correct.
Question
Question
Red coloration in wheat seeds is a complex trait influenced by three unlinked genes, each with two different alleles A and a; B and b; C and c. This Punnett square shows the results of a mating between two plants that are both heterozygous at all three genes. 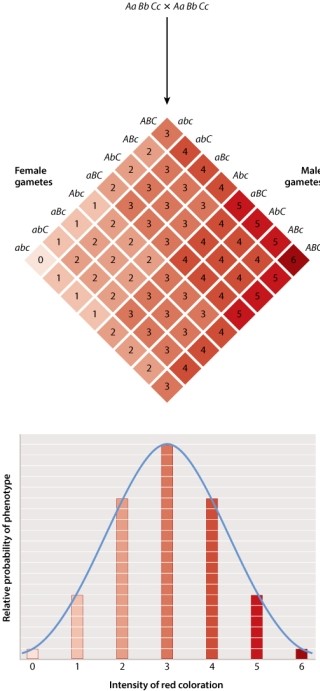 Each dominant allele, represented by an uppercase letter, contributes to the red coloration.
Each dominant allele, represented by an uppercase letter, contributes to the red coloration. Question
Question
In a parent-offspring regression experiment, suggest a hypothesis that could explain the solid line in the graph below. 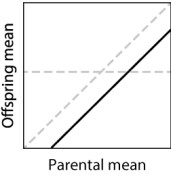
A)The offspring have a worse environment than the parents had.
B)The offspring have a better environment than the parents had.
C)The trait has a heritability that is less than 0.
D)The trait has a heritability that is greater than 1.
E)None of the other answer options is correct.
A)The offspring have a worse environment than the parents had.
B)The offspring have a better environment than the parents had.
C)The trait has a heritability that is less than 0.
D)The trait has a heritability that is greater than 1.
E)None of the other answer options is correct.
Question
Red coloration in wheat seeds is a complex trait influenced by three unlinked genes, each with two different alleles A and a; B and b; C and c. This Punnett square shows the results of a mating between two plants that are both heterozygous at all three loci. 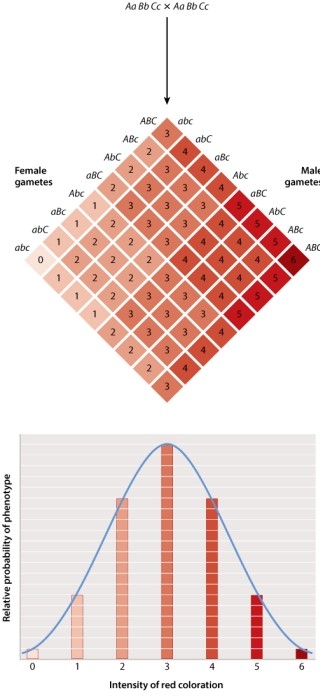 The gene products from the dominant genes are additive in their influence on the red coloration.
The gene products from the dominant genes are additive in their influence on the red coloration. Question
Question
Question
Question
Question
Question
Question
Red coloration in wheat seeds is a complex trait influenced by three unlinked genes, each with two different alleles A and a; B and b; C and c. This Punnett square shows the results of a mating between two plants that are both heterozygous at all three loci.  The intensity of the red color phenotype is influenced by only one of the gene products.
The intensity of the red color phenotype is influenced by only one of the gene products. Question
Question
In which of the complex traits shown here is variation determined almost completely by heredity? 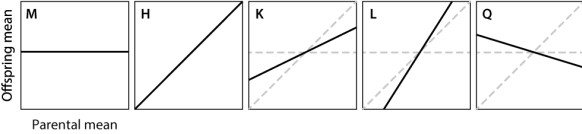
A)trait M
B)trait H
C)trait K
D)trait L
E)trait Q
A)trait M
B)trait H
C)trait K
D)trait L
E)trait Q
Question
Red coloration in wheat seeds is a complex trait influenced by three unlinked genes, each with two different alleles A and a; B and b; C and c. This Punnett square shows the results of a mating between two plants that are both heterozygous at all three loci.  The recessive alleles do not contribute to the red coloration of the seed casing.
The recessive alleles do not contribute to the red coloration of the seed casing. Question
Question
Question
Which of the traits depicted here has the GREATEST heritability? 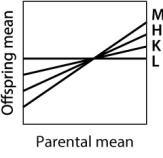
A)trait M
B)trait H
C)trait K
D)trait L
A)trait M
B)trait H
C)trait K
D)trait L
Question
Question
In the graph of Galton's height data below, which line on the graph represents the mean height of the offspring for a given average height of the mother and father? 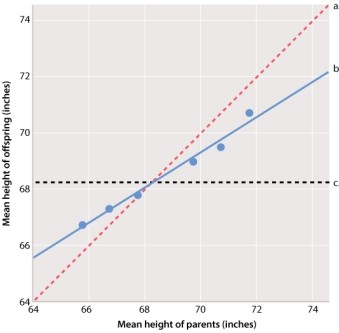
A)line a
B)line b
C)line c
A)line a
B)line b
C)line c
Question
After reviewing the graph below, one could state that: 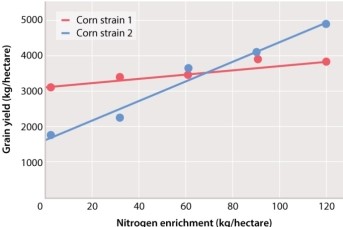
A)grain yield of strain 1 is less dependent than strain 2 on the nitrogen enrichment of the soil.
B)at a nitrogen enrichment of 40 kg/hectare, strain 2 provides a higher yield of grain.
C)nitrogen enrichment has little effect on grain yield of strain 2.
D)strain 1 is the superior choice for grain yield.
E)no interaction effect is observed between nitrogen enrichment and grain yield for either strain.
Question
The scatterplots below show the relation between the average phenotype of parents (x-axis) and that of their offspring (y-axis) for three traits. One trait has a heritability of 90% (comparable to that of fingerprint ridge count), another has a heritability of 50% (comparable to that of human height), and yet another has a heritability of 25% (comparable to that of human longevity). To make the axes comparable, for each trait the phenotypic measurement is expressed as a deviation from the overall mean in multiples of the standard deviation. 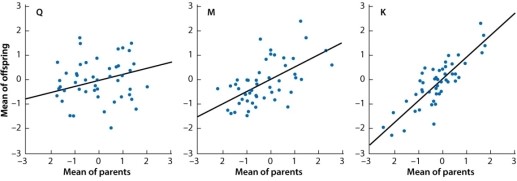 The fact that all of the lines slope upward means that:
A)variation in each trait is affected by differences in heredity.
B)variation in each trait is affected by environmental differences.
C)the genes affecting any one trait have no effect on any other trait.
D)some genes affect all three traits.
E)the traits all show genotype-by-environment interaction.
The fact that all of the lines slope upward means that:A)variation in each trait is affected by differences in heredity.
B)variation in each trait is affected by environmental differences.
C)the genes affecting any one trait have no effect on any other trait.
D)some genes affect all three traits.
E)the traits all show genotype-by-environment interaction.
Question
In the graph of Galton's height data below, which line on the graph represents the population mean? 
A)line a
B)line b
C)line c
A)line a
B)line b
C)line c
Question
Which line on the graph below demonstrates Galton's concept of regression toward the mean? 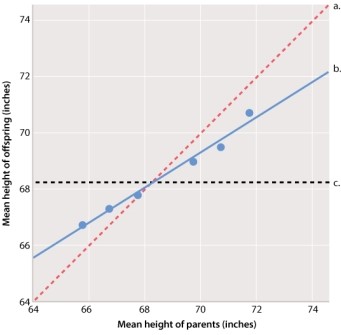
A)line a
B)line b
C)line c
A)line a
B)line b
C)line c
Question
Question
Question
Question
Question
Question
Question
In which of the complex traits shown here is variation determined almost completely by the environment? 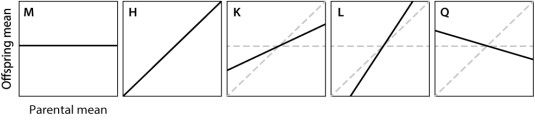
A)trait M
B)trait H
C)trait K
D)trait L
E)trait Q
A)trait M
B)trait H
C)trait K
D)trait L
E)trait Q
Question
In the graph of Galton's height data below, which line on the graph represents the average height of the parents in a mating? 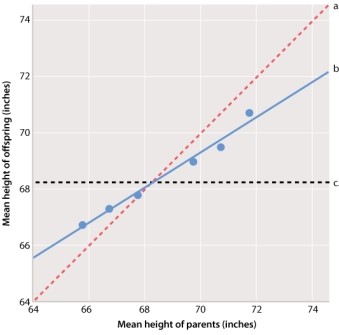
A)line a
B)line b
C)line c
A)line a
B)line b
C)line c
Question
Which of the traits depicted here illustrates regression toward the mean? 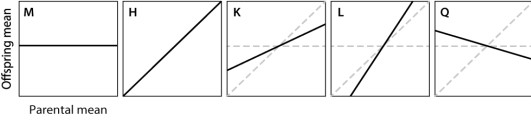
A)trait M
B)trait H
C)trait K
D)trait L
E)trait Q
A)trait M
B)trait H
C)trait K
D)trait L
E)trait Q
Question
Question
Which of the traits depicted here has the SMALLEST heritability? 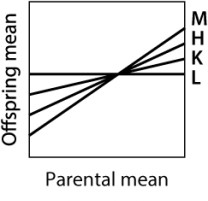
A)trait M
B)trait H
C)trait K
D)trait L
A)trait M
B)trait H
C)trait K
D)trait L
Question
The scatterplots show the relation between the average phenotype of parents (x-axis) and that of their offspring (y-axis) for two traits in a variety of tropical sweet corn. One trait is ear height, which has a heritability of 75%; and the other is ear length, which has a heritability of 25%. To make the axes comparable, for each trait the phenotypic measurement is expressed as a deviation from the overall mean in multiples of the standard deviation. Which of the following matchups is CORRECT? 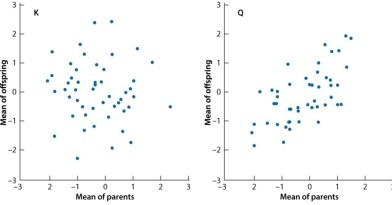
A)Ear length is trait K and ear height is trait Q.
B)Ear length is trait Q and ear height is trait K.
C)Ear length and ear height are both trait K.
D)Ear length and ear height are both trait Q.
A)Ear length is trait K and ear height is trait Q.
B)Ear length is trait Q and ear height is trait K.
C)Ear length and ear height are both trait K.
D)Ear length and ear height are both trait Q.
Question
Question
Question

Unlock Deck
Sign up to unlock the cards in this deck!
Unlock Deck
Unlock Deck
1/164
Play
Full screen (f)
Deck 18: The Genetic and Environmental Basis of Complex Traits
1
Which of the following are complex traits in humans?
A)depression
B)height
C)autism
D)cystic fibrosis
A)depression
B)height
C)autism
D)cystic fibrosis
A, B, C
2
In general, the phenotypes of a complex trait should exhibit a(n) _____ distribution.
A)complex
B)normal
C)skewed
D)inverted
E)bimodal
A)complex
B)normal
C)skewed
D)inverted
E)bimodal
B
3
The graph here shows the results of growing one strain of a crop plant in soils with different nitrogen contents. If a different strain of the same plant were grown in the same soils, you would predict that:
A)it would respond the same way to nitrogen supplementation because they are the same plant.
B)it would respond completely differently to nitrogen supplementation because they are different strains.
C)it could respond the same way or differently; different genotypes can, but may not always, respond differently to the same range of environments.
D)it could respond the same way or differently; the environment has too many variables to predict.
E)None of the answer options is correct.
If a different strain of the same plant were grown in the same soils, you would predict that:A)it would respond the same way to nitrogen supplementation because they are the same plant.
B)it would respond completely differently to nitrogen supplementation because they are different strains.
C)it could respond the same way or differently; different genotypes can, but may not always, respond differently to the same range of environments.
D)it could respond the same way or differently; the environment has too many variables to predict.
E)None of the answer options is correct.
C
4
The plots shown here depict several possible outcomes of an experiment comparing the mean phenotype of a behavioral trait in two strains of mice in three environments. Strain 1 is represented by filled circles and Strain 2 is represented by open circles. Environment 1 (E1) is deficient in stimulation for the behavior, environment 2 (E2) has an average level of stimulation, and environment 3 (E3) is enriched in stimulation. Which of the possible results indicates the presence of genotype-by-environment interaction for one or both of the strains?
A)result M
B)result H
C)result K
D)result L
E)None of the answer options is correct.
A)result M
B)result H
C)result K
D)result L
E)None of the answer options is correct.
Unlock Deck
Unlock for access to all 164 flashcards in this deck.
Unlock Deck
k this deck
5
Inbred lines of animals, such as laboratory mice, are useful for studying complex traits because:
A)individuals are genetically identical, so differences in traits must be due to environmental differences.
B)although individuals differ both genetically and environmentally, the genetic differences are known, so differences in traits can be understood.
C)animals are kept in identical environments, so any differences in traits are due to differences in their genes.
D)both genetic and environmental differences between individuals are known, making differences in their traits easy to understand.
E)None of the answer options is correct.
Unlock Deck
Unlock for access to all 164 flashcards in this deck.
Unlock Deck
k this deck
6
Which of the following statements BEST reflects the extent to which we can distinguish the effects of genes and the environment on the expression of a complex trait?
A)About 80% of an individual's height is determined by genes and 20% by environment.
B)For identical twins raised in the same environment, height should not differ by more than 20%.
C)In a group of individuals of the same sex, about 80% of the variation in height among individuals is due to genetic differences and 20% is due to environmental differences.
D)If one individual is 60 inches tall and another is 70 inches tall, they differ in about 80% of their genes.
E)None of answer options is correct.
Unlock Deck
Unlock for access to all 164 flashcards in this deck.
Unlock Deck
k this deck
7
If the value of the trait in 16% of the population is equal to 6 or greater, in what percentage of the population is the value of the trait greater than 4?
A)8%
B)16%
C)32%
D)68%
E)84%
A)8%
B)16%
C)32%
D)68%
E)84%
Unlock Deck
Unlock for access to all 164 flashcards in this deck.
Unlock Deck
k this deck
8
Which of the graphs below would likely represent the distribution of a complex trait?
A)graph A
B)graph B
C)graph C
D)graph D
A)graph A
B)graph B
C)graph C
D)graph D
Unlock Deck
Unlock for access to all 164 flashcards in this deck.
Unlock Deck
k this deck
9
Studies have shown that 5%-10% of all breast cancers are related to mutations in BRCA1 and BRCA2. A logical conclusion from these data is that:
A)most women with breast cancer have mutations in one or both of these genes.
B)most women with breast cancer must have inherited the gene from their mother.
C)at least some breast cancers are caused by the environment or by genes other than BRCA1 and BRCA2.
D)not all mutations in BRCA1 and BRCA2 have been identified to account for the other 90%-95% of breast cancers.
Unlock Deck
Unlock for access to all 164 flashcards in this deck.
Unlock Deck
k this deck
10
Which of the graphs below would likely represent the distribution of a simple, single gene trait?
A)graph A
B)graph B
C)graph C
D)graph D
A)graph A
B)graph B
C)graph C
D)graph D
Unlock Deck
Unlock for access to all 164 flashcards in this deck.
Unlock Deck
k this deck
11
A key difference between single gene traits such as those Mendel studied and complex traits such as human height is that:
A)complex traits are generally not significantly influenced by the environment, whereas single gene traits have a significant environmental component.
B)single gene traits are generally not significantly influenced by the environment, whereas complex traits have a significant environmental component.
C)complex traits show incomplete dominance, whereas single gene traits show complete dominance.
D)single gene traits show both complete and incomplete dominance, whereas complex traits show only complete dominance.
E)None of the answer options is correct.
Unlock Deck
Unlock for access to all 164 flashcards in this deck.
Unlock Deck
k this deck
12
Complex traits are often called _____ because they _____.
A)qualitative; come in one of several discrete (distinct)forms
B)external; are influenced by the environment as well as by genes
C)quantitative; can be measured
D)epistatic; are influenced by many genes
E)environmental; are influenced by the environment as well as by genes
A)qualitative; come in one of several discrete (distinct)forms
B)external; are influenced by the environment as well as by genes
C)quantitative; can be measured
D)epistatic; are influenced by many genes
E)environmental; are influenced by the environment as well as by genes
Unlock Deck
Unlock for access to all 164 flashcards in this deck.
Unlock Deck
k this deck
13
Inbred lines show:
A)no phenotypic variation.
B)phenotypic variation due to genetic variation.
C)phenotypic variation due to environmental variation.
D)phenotypic variation due to genotype-by-environment interaction.
E)None of the answer options is correct.
A)no phenotypic variation.
B)phenotypic variation due to genetic variation.
C)phenotypic variation due to environmental variation.
D)phenotypic variation due to genotype-by-environment interaction.
E)None of the answer options is correct.
Unlock Deck
Unlock for access to all 164 flashcards in this deck.
Unlock Deck
k this deck
14
A complex trait can be influenced by the environment.
Unlock Deck
Unlock for access to all 164 flashcards in this deck.
Unlock Deck
k this deck
15
Consider a simple Mendelian trait that is due to a single gene with alleles A and a. In one environment, allele A is dominant, whereas in a different environment allele a is dominant. This is an example of:
A)a complex trait.
B)epistasis.
C)genotype-by-environment interaction.
D)genotype-by-environment discordance.
A)a complex trait.
B)epistasis.
C)genotype-by-environment interaction.
D)genotype-by-environment discordance.
Unlock Deck
Unlock for access to all 164 flashcards in this deck.
Unlock Deck
k this deck
16
One reason that the effects of individual genes on complex traits can be difficult to determine is that:
A)environmental effects cannot be measured.
B)environmental effects are so large that genetic effects cannot be measured.
C)a single phenotype may be produced by many different genotypes.
D)neither environmental nor genetic effects can be measured.
E)genetic effects cannot be measured, regardless of the effects of the environment.
Unlock Deck
Unlock for access to all 164 flashcards in this deck.
Unlock Deck
k this deck
17
The phenotypes of complex traits vary with both genotype and environment. An important implication of this is that:
A)we can't predict the expression of a genotype without knowing its environment.
B)we can't predict how a given environment will affect the expression of a trait without knowing its genotype.
C)no one genotype will produce the "best" phenotype in all environments.
D)several different genotypes may produce equally fit phenotypes in the same environment.
E)All of these choices are correct.
Unlock Deck
Unlock for access to all 164 flashcards in this deck.
Unlock Deck
k this deck
18
Phenylketonuria (PKU) is a metabolic disorder that results in a mental handicap when phenylalanine is present in the diet. It was found that putting children with this genetic defect on a special diet prevented the effects of the disease. This is an example of:
A)correlation between genotype and environment.
B)variable norms of reaction.
C)genotype-by-environment interaction.
D)phenotypic variation due to genetic variation.
E)None of the answer options is correct.
A)correlation between genotype and environment.
B)variable norms of reaction.
C)genotype-by-environment interaction.
D)phenotypic variation due to genetic variation.
E)None of the answer options is correct.
Unlock Deck
Unlock for access to all 164 flashcards in this deck.
Unlock Deck
k this deck
19
A farmer in Kansas and a farmer in California each plant an acre of the same variety of corn. Because the environment differs for each field, how will this affect the height of their corn?
A)The average height of the corn could differ between fields.
B)The variation in the height of the corn in each field could differ between fields.
C)The color and seed shape of the corn could differ between fields.
D)Both the average height of the corn and the variation in corn height within each field could differ between fields.
E)Average height, variation in height, seed color, and seed shape could all differ between fields.
Unlock Deck
Unlock for access to all 164 flashcards in this deck.
Unlock Deck
k this deck
20
Of the students in your class, 95% are between 140 cm and 180 cm tall. Assuming that these data are normally distributed, what is the mean height of the students?
A)140 cm
B)150 cm
C)160 cm
D)170 cm
E)180 cm
A)140 cm
B)150 cm
C)160 cm
D)170 cm
E)180 cm
Unlock Deck
Unlock for access to all 164 flashcards in this deck.
Unlock Deck
k this deck
21
Five varieties of hybrid corn are studied for average yield of corn (the phenotype) as a function of annual rainfall (the environment), with the results shown here. Each of these lines constitutes a:
A)normative assessment.
B)genotype-by-environment interaction.
C)normalizing transformation.
D)normal curve of error.
E)norm of reaction.
Each of these lines constitutes a:A)normative assessment.
B)genotype-by-environment interaction.
C)normalizing transformation.
D)normal curve of error.
E)norm of reaction.
Unlock Deck
Unlock for access to all 164 flashcards in this deck.
Unlock Deck
k this deck
22
Inbred lines are:
A)possible only in plants.
B)possible only in animals.
C)present in some human populations.
D)homozygous for all genes.
E)heterozygous for all genes.
A)possible only in plants.
B)possible only in animals.
C)present in some human populations.
D)homozygous for all genes.
E)heterozygous for all genes.
Unlock Deck
Unlock for access to all 164 flashcards in this deck.
Unlock Deck
k this deck
23
Most human variation is due to _____ traits.
A)single gene
B)complex
C)epistatic
D)nondisjunction
E)incompletely dominant
A)single gene
B)complex
C)epistatic
D)nondisjunction
E)incompletely dominant
Unlock Deck
Unlock for access to all 164 flashcards in this deck.
Unlock Deck
k this deck
24
The plots shown here depict several possible outcomes of an experiment comparing the mean phenotype of a behavioral trait in two strains of mice in three environments. Strain 1 is represented by filled circles and Strain 2 is represented by open circles. Environment 1 (E1) is deficient in stimulation for the behavior, environment 2 (E2) has an average level of stimulation, and environment 3 (E3) is enriched in stimulation. Which of the possible results indicates the absence of genotype-by-environment interaction?
A)result M
B)result H
C)result K
D)result L
E)None of the answer options is correct.
A)result M
B)result H
C)result K
D)result L
E)None of the answer options is correct.
Unlock Deck
Unlock for access to all 164 flashcards in this deck.
Unlock Deck
k this deck
25
Lack of exercise is an example of a(n) _____ for/of obesity and diabetes.
A)complex trait
B)quantitative trait
C)cause
D)environmental risk factor
E)genetic risk factor
A)complex trait
B)quantitative trait
C)cause
D)environmental risk factor
E)genetic risk factor
Unlock Deck
Unlock for access to all 164 flashcards in this deck.
Unlock Deck
k this deck
26
Ten individuals of two inbred strains of mice, A and B, are fed identical diets. All have normal blood sugar as adults. The same mice are then fed diets high in sugar. Mice from strain B develop diabetes, but mice from strain A do not. Diabetes in strain B mice results from:
A)the interaction of their diet with their genotype.
B)their genotypes, which are different from strain A mice.
C)their diets, which are different from strain A mice.
D)their norm of reaction to sugar in their diets.
E)None of the other answer choices is correct.
A)the interaction of their diet with their genotype.
B)their genotypes, which are different from strain A mice.
C)their diets, which are different from strain A mice.
D)their norm of reaction to sugar in their diets.
E)None of the other answer choices is correct.
Unlock Deck
Unlock for access to all 164 flashcards in this deck.
Unlock Deck
k this deck
27
Environmental effects have no impact on true-breeding, homozygous strains (inbred lines) of plants or animals.
Unlock Deck
Unlock for access to all 164 flashcards in this deck.
Unlock Deck
k this deck
28
Single-gene traits are more likely to be influenced by the environment.
Unlock Deck
Unlock for access to all 164 flashcards in this deck.
Unlock Deck
k this deck
29
Which of the following are complex traits?
A)type II diabetes
B)red-green color blindness
C)hemophilia
D)obesity
E)sickle-cell anemia
A)type II diabetes
B)red-green color blindness
C)hemophilia
D)obesity
E)sickle-cell anemia
Unlock Deck
Unlock for access to all 164 flashcards in this deck.
Unlock Deck
k this deck
30
Sunlight exposure has stronger effect on skin cancer risk in fair-skinned humans than in individuals with darker skin. This is an example of:
A)pleiotropy.
B)epistasis.
C)genotype-by-environment interaction.
D)differences in the norm of reaction.
E)All of these choices are correct.
A)pleiotropy.
B)epistasis.
C)genotype-by-environment interaction.
D)differences in the norm of reaction.
E)All of these choices are correct.
Unlock Deck
Unlock for access to all 164 flashcards in this deck.
Unlock Deck
k this deck
31
Diets high in fat and carbohydrates affect inbred lines of mice differently. One line becomes obese and the other does not. This is called a _____ interaction.
A)genotype-by-environment
B)phenotype-by-environment
C)genotype-by-phenotype
D)genotype-by-trait
E)phenotype-by-genotype
A)genotype-by-environment
B)phenotype-by-environment
C)genotype-by-phenotype
D)genotype-by-trait
E)phenotype-by-genotype
Unlock Deck
Unlock for access to all 164 flashcards in this deck.
Unlock Deck
k this deck
32
The traits that Mendel studied are most often influenced by single genes.
Unlock Deck
Unlock for access to all 164 flashcards in this deck.
Unlock Deck
k this deck
33
As many as two-thirds of the American population suffers from disorders determined by multiple genes and environmental factors.
Unlock Deck
Unlock for access to all 164 flashcards in this deck.
Unlock Deck
k this deck
34
When differences in the phenotype due to the environment can be ignored:
A)the environmental component of a complex trait can be more easily identified.
B)the genetic variation underlying phenotypic differences can be more easily identified.
C)the trait is not considered a complex trait.
D)epistatic interactions determine phenotypes.
E)All of these choices are correct.
A)the environmental component of a complex trait can be more easily identified.
B)the genetic variation underlying phenotypic differences can be more easily identified.
C)the trait is not considered a complex trait.
D)epistatic interactions determine phenotypes.
E)All of these choices are correct.
Unlock Deck
Unlock for access to all 164 flashcards in this deck.
Unlock Deck
k this deck
35
Traits that are influenced by multiple genes and the environment are called _____ traits.
A)Mendelian
B)complex
C)environmental
D)simple
E)multiplex
A)Mendelian
B)complex
C)environmental
D)simple
E)multiplex
Unlock Deck
Unlock for access to all 164 flashcards in this deck.
Unlock Deck
k this deck
36
Which of the following traits would you expect to conform to a normal distribution?
A)hypertension (high blood pressure)
B)type II diabetes
C)Alzheimer's disease
D)albinism
E)sickle-cell anemia
A)hypertension (high blood pressure)
B)type II diabetes
C)Alzheimer's disease
D)albinism
E)sickle-cell anemia
Unlock Deck
Unlock for access to all 164 flashcards in this deck.
Unlock Deck
k this deck
37
Which of the following are quantitative traits?
A)serum cholesterol
B)blood pressure
C)height
D)weight
E)skin color
A)serum cholesterol
B)blood pressure
C)height
D)weight
E)skin color
Unlock Deck
Unlock for access to all 164 flashcards in this deck.
Unlock Deck
k this deck
38
Salt intake is associated with an increased likelihood of high blood pressure and is therefore a(n) _____ of this common disorder.
A)environmental risk factor
B)genetic risk factor
C)complex trait
D)simple trait
E)associative risk factor
A)environmental risk factor
B)genetic risk factor
C)complex trait
D)simple trait
E)associative risk factor
Unlock Deck
Unlock for access to all 164 flashcards in this deck.
Unlock Deck
k this deck
39
Variation in the effects of the environment on different genotypes is known as:
A)the norm of reaction.
B)complex variation.
C)genotype-by-genotype variation.
D)genotype-by-environment interaction.
E)environment-by-environment variation.
A)the norm of reaction.
B)complex variation.
C)genotype-by-genotype variation.
D)genotype-by-environment interaction.
E)environment-by-environment variation.
Unlock Deck
Unlock for access to all 164 flashcards in this deck.
Unlock Deck
k this deck
40
Traits such as human height, blood pressure, and blood sugar levels can be measured along a continuum and are often called _____ traits.
A)qualitative
B)associative
C)quantitative
D)continuous
E)contradictory
A)qualitative
B)associative
C)quantitative
D)continuous
E)contradictory
Unlock Deck
Unlock for access to all 164 flashcards in this deck.
Unlock Deck
k this deck
41
In a parent-offspring regression experiment, suggest a hypothesis that could explain the solid line in the following graph.
A)The offspring have a "worse" environment than the parents did.
B)The offspring have a "better" environment than the parents did.
C)The trait has a heritability that is less than 0.
D)The trait has a heritability that is greater than 1.
E)None of the answer options is correct.
A)The offspring have a "worse" environment than the parents did.
B)The offspring have a "better" environment than the parents did.
C)The trait has a heritability that is less than 0.
D)The trait has a heritability that is greater than 1.
E)None of the answer options is correct.
Unlock Deck
Unlock for access to all 164 flashcards in this deck.
Unlock Deck
k this deck
42
Genotype-by-environment interaction means that genetic and environmental influences may interact or contribute to the phenotypic outcomes in unpredictable ways.
Unlock Deck
Unlock for access to all 164 flashcards in this deck.
Unlock Deck
k this deck
43
Red coloration in wheat seeds is a complex trait influenced by three unlinked genes, each with two different alleles A and a; B and b; C and c. This Punnett square shows the results of a mating between two plants that are both heterozygous at all three genes. Each dominant allele, represented by an uppercase letter, contributes to the red coloration.
Each dominant allele, represented by an uppercase letter, contributes to the red coloration. Unlock Deck
Unlock for access to all 164 flashcards in this deck.
Unlock Deck
k this deck
44
Nilsson-Ehle studied the effects of a small number of genes on a particular trait and found that the Mendelian laws of inheritance did not apply.
Unlock Deck
Unlock for access to all 164 flashcards in this deck.
Unlock Deck
k this deck
45
In a parent-offspring regression experiment, suggest a hypothesis that could explain the solid line in the graph below.
A)The offspring have a worse environment than the parents had.
B)The offspring have a better environment than the parents had.
C)The trait has a heritability that is less than 0.
D)The trait has a heritability that is greater than 1.
E)None of the other answer options is correct.
A)The offspring have a worse environment than the parents had.
B)The offspring have a better environment than the parents had.
C)The trait has a heritability that is less than 0.
D)The trait has a heritability that is greater than 1.
E)None of the other answer options is correct.
Unlock Deck
Unlock for access to all 164 flashcards in this deck.
Unlock Deck
k this deck
46
Red coloration in wheat seeds is a complex trait influenced by three unlinked genes, each with two different alleles A and a; B and b; C and c. This Punnett square shows the results of a mating between two plants that are both heterozygous at all three loci. The gene products from the dominant genes are additive in their influence on the red coloration.
The gene products from the dominant genes are additive in their influence on the red coloration. Unlock Deck
Unlock for access to all 164 flashcards in this deck.
Unlock Deck
k this deck
47
You are studying a large flock of chickens and divide it into two halves. Each half contains the same genetic variations at the same frequencies as in the other half. To one half (the control group) you feed normal chicken chow, to the other half (the experimental group) you feed normal chicken chow supplemented with a nutritional booster. As expected, in the experimental group the hens lay an average number of eggs greater than those in the control group. Yet the heritability remains the same in both the experimental and control groups. You can explain this observation by hypothesizing that the variation in nutrition among hens is:
A)smaller in the experimental group.
B)larger in the experimental group.
C)the same in both groups.
D)smaller in the control group.
E)larger in the control group.
A)smaller in the experimental group.
B)larger in the experimental group.
C)the same in both groups.
D)smaller in the control group.
E)larger in the control group.
Unlock Deck
Unlock for access to all 164 flashcards in this deck.
Unlock Deck
k this deck
48
You study a complex trait in the offspring of a cross between inbred lines, and you discover that the heritability is 0. How can this result be explained?
A)There is no genetic variation among offspring.
B)The offspring are homozygous for all genes in which the parents differ.
C)The offspring are heterozygous for all genes in which the parents differ.
D)The environmental variation on the trait is huge.
E)None of the other answer options is correct.
A)There is no genetic variation among offspring.
B)The offspring are homozygous for all genes in which the parents differ.
C)The offspring are heterozygous for all genes in which the parents differ.
D)The environmental variation on the trait is huge.
E)None of the other answer options is correct.
Unlock Deck
Unlock for access to all 164 flashcards in this deck.
Unlock Deck
k this deck
49
If all variation among individuals in a population is due to differing environments, heritability is _____, and the slope of the line used to measure it is _____.
A)100%; 0.5
B)100%; 1
C)50%; 0.5
D)50%; 1
E)0; 0
A)100%; 0.5
B)100%; 1
C)50%; 0.5
D)50%; 1
E)0; 0
Unlock Deck
Unlock for access to all 164 flashcards in this deck.
Unlock Deck
k this deck
50
A trait with high heritability will respond quickly to:
A)artificial selection.
B)natural selection.
C)changes in the environment.
D)both artificial selection and natural selection.
E)artificial selection, natural selection, and changes in the environment.
A)artificial selection.
B)natural selection.
C)changes in the environment.
D)both artificial selection and natural selection.
E)artificial selection, natural selection, and changes in the environment.
Unlock Deck
Unlock for access to all 164 flashcards in this deck.
Unlock Deck
k this deck
51
Heritability is measured as:
A)the slope of the line that relates the average phenotype of parents to the average phenotype of their offspring.
B)the slope of the line that relates the average phenotype of parents to the average environment in which they live.
C)the slope of the line that relates individual phenotype to environmental conditions.
D)how skewed the distribution of offspring phenotypes is.
E)the difference between the norms of reaction of two phenotypes across the same range of environmental conditions.
Unlock Deck
Unlock for access to all 164 flashcards in this deck.
Unlock Deck
k this deck
52
When studying phenotypic variations due to the environment, it is necessary to compare organisms with identical genotypes. In addition, it is necessary to use identical environments when studying variation due to differing genotypes.
Unlock Deck
Unlock for access to all 164 flashcards in this deck.
Unlock Deck
k this deck
53
Red coloration in wheat seeds is a complex trait influenced by three unlinked genes, each with two different alleles A and a; B and b; C and c. This Punnett square shows the results of a mating between two plants that are both heterozygous at all three loci. The intensity of the red color phenotype is influenced by only one of the gene products.
The intensity of the red color phenotype is influenced by only one of the gene products. Unlock Deck
Unlock for access to all 164 flashcards in this deck.
Unlock Deck
k this deck
54
Which of the traits in the table below has the GREATEST heritability?
A)trait M
B)trait H
C)trait K
D)trait L
E)trait Q
A)trait M
B)trait H
C)trait K
D)trait L
E)trait Q
Unlock Deck
Unlock for access to all 164 flashcards in this deck.
Unlock Deck
k this deck
55
In which of the complex traits shown here is variation determined almost completely by heredity?
A)trait M
B)trait H
C)trait K
D)trait L
E)trait Q
A)trait M
B)trait H
C)trait K
D)trait L
E)trait Q
Unlock Deck
Unlock for access to all 164 flashcards in this deck.
Unlock Deck
k this deck
56
Red coloration in wheat seeds is a complex trait influenced by three unlinked genes, each with two different alleles A and a; B and b; C and c. This Punnett square shows the results of a mating between two plants that are both heterozygous at all three loci. The recessive alleles do not contribute to the red coloration of the seed casing.
The recessive alleles do not contribute to the red coloration of the seed casing. Unlock Deck
Unlock for access to all 164 flashcards in this deck.
Unlock Deck
k this deck
57
In regard to gaining weight, some human genotypes may tolerate a high-fat diet more than others.
Unlock Deck
Unlock for access to all 164 flashcards in this deck.
Unlock Deck
k this deck
58
Genetic differences are always more important than environmental differences for determining phenotypic outcomes.
Unlock Deck
Unlock for access to all 164 flashcards in this deck.
Unlock Deck
k this deck
59
Which of the traits depicted here has the GREATEST heritability?
A)trait M
B)trait H
C)trait K
D)trait L
A)trait M
B)trait H
C)trait K
D)trait L
Unlock Deck
Unlock for access to all 164 flashcards in this deck.
Unlock Deck
k this deck
60
Similar to single gene traits, traits determined by multiple genes also show the expected 3:1 ratio of phenotypes in the progeny between two heterozygotes.
Unlock Deck
Unlock for access to all 164 flashcards in this deck.
Unlock Deck
k this deck
61
In the graph of Galton's height data below, which line on the graph represents the mean height of the offspring for a given average height of the mother and father?
A)line a
B)line b
C)line c
A)line a
B)line b
C)line c
Unlock Deck
Unlock for access to all 164 flashcards in this deck.
Unlock Deck
k this deck
62
After reviewing the graph below, one could state that:
A)grain yield of strain 1 is less dependent than strain 2 on the nitrogen enrichment of the soil.
B)at a nitrogen enrichment of 40 kg/hectare, strain 2 provides a higher yield of grain.
C)nitrogen enrichment has little effect on grain yield of strain 2.
D)strain 1 is the superior choice for grain yield.
E)no interaction effect is observed between nitrogen enrichment and grain yield for either strain.
Unlock Deck
Unlock for access to all 164 flashcards in this deck.
Unlock Deck
k this deck
63
The scatterplots below show the relation between the average phenotype of parents (x-axis) and that of their offspring (y-axis) for three traits. One trait has a heritability of 90% (comparable to that of fingerprint ridge count), another has a heritability of 50% (comparable to that of human height), and yet another has a heritability of 25% (comparable to that of human longevity). To make the axes comparable, for each trait the phenotypic measurement is expressed as a deviation from the overall mean in multiples of the standard deviation. The fact that all of the lines slope upward means that:
A)variation in each trait is affected by differences in heredity.
B)variation in each trait is affected by environmental differences.
C)the genes affecting any one trait have no effect on any other trait.
D)some genes affect all three traits.
E)the traits all show genotype-by-environment interaction.
The fact that all of the lines slope upward means that:A)variation in each trait is affected by differences in heredity.
B)variation in each trait is affected by environmental differences.
C)the genes affecting any one trait have no effect on any other trait.
D)some genes affect all three traits.
E)the traits all show genotype-by-environment interaction.
Unlock Deck
Unlock for access to all 164 flashcards in this deck.
Unlock Deck
k this deck
64
In the graph of Galton's height data below, which line on the graph represents the population mean?
A)line a
B)line b
C)line c
A)line a
B)line b
C)line c
Unlock Deck
Unlock for access to all 164 flashcards in this deck.
Unlock Deck
k this deck
65
Which line on the graph below demonstrates Galton's concept of regression toward the mean?
A)line a
B)line b
C)line c
A)line a
B)line b
C)line c
Unlock Deck
Unlock for access to all 164 flashcards in this deck.
Unlock Deck
k this deck
66
Heritability is a measure of the:
A)extent to which a trait is passed from parent to offspring.
B)proportion of a trait that is determined by genes rather than by the environment.
C)proportion of total variation in a trait that is due to genetic differences among individuals within a population.
D)extent to which a trait exhibits regression toward the mean in a population.
E)norm of reaction of a trait.
Unlock Deck
Unlock for access to all 164 flashcards in this deck.
Unlock Deck
k this deck
67
Heritability is the proportion of the total phenotypic variation in a trait that is the result of:
A)genetic variation among individuals.
B)environmental variation among the individuals.
C)variation in the degree of dominance of different genes.
D)variation in the degree of epistasis among genes.
E)variation in the frequency of recombination between genes.
A)genetic variation among individuals.
B)environmental variation among the individuals.
C)variation in the degree of dominance of different genes.
D)variation in the degree of epistasis among genes.
E)variation in the frequency of recombination between genes.
Unlock Deck
Unlock for access to all 164 flashcards in this deck.
Unlock Deck
k this deck
68
Nilsson-Ehle's studies of seed color in wheat were important because they showed that:
A)complex traits have a large environmental component.
B)inbred strains can be used to study the environmental component of complex traits.
C)complex traits are subject to Mendelian laws of inheritance.
D)complex traits are not subject to Mendelian laws of inheritance.
E)complex traits both have a large environmental component and are subject to Mendelian laws of inheritance.
Unlock Deck
Unlock for access to all 164 flashcards in this deck.
Unlock Deck
k this deck
69
Which of the traits in the accompanying table has the GREATEST heritability?
A)trait M
B)trait H
C)trait K
D)trait L
E)trait Q
A)trait M
B)trait H
C)trait K
D)trait L
E)trait Q
Unlock Deck
Unlock for access to all 164 flashcards in this deck.
Unlock Deck
k this deck
70
When heritability is 100%, the variation among individuals in the population is due to:
A)genotype.
B)phenotype.
C)Both of these choices are correct.
A)genotype.
B)phenotype.
C)Both of these choices are correct.
Unlock Deck
Unlock for access to all 164 flashcards in this deck.
Unlock Deck
k this deck
71
If all variation among individuals in a population is due to differing genotypes alone, heritability is _____, and the slope of the line used to measure it is _____.
A)100%; 0.5
B)100%; 1
C)50%; 0.5
D)50%; 1
E)0%; 0
A)100%; 0.5
B)100%; 1
C)50%; 0.5
D)50%; 1
E)0%; 0
Unlock Deck
Unlock for access to all 164 flashcards in this deck.
Unlock Deck
k this deck
72
In which of the complex traits shown here is variation determined almost completely by the environment?
A)trait M
B)trait H
C)trait K
D)trait L
E)trait Q
A)trait M
B)trait H
C)trait K
D)trait L
E)trait Q
Unlock Deck
Unlock for access to all 164 flashcards in this deck.
Unlock Deck
k this deck
73
In the graph of Galton's height data below, which line on the graph represents the average height of the parents in a mating?
A)line a
B)line b
C)line c
A)line a
B)line b
C)line c
Unlock Deck
Unlock for access to all 164 flashcards in this deck.
Unlock Deck
k this deck
74
Which of the traits depicted here illustrates regression toward the mean?
A)trait M
B)trait H
C)trait K
D)trait L
E)trait Q
A)trait M
B)trait H
C)trait K
D)trait L
E)trait Q
Unlock Deck
Unlock for access to all 164 flashcards in this deck.
Unlock Deck
k this deck
75
When heritability is 100%, the environment plays:
A)no role in the expression of the trait.
B)a role in the expression of a trait, but it is a small one.
C)a role in the expression of a trait, but it cannot be measured.
D)no role in variation in the trait among individuals.
E)a role in variation in the trait among individuals, but it cannot be measured.
Unlock Deck
Unlock for access to all 164 flashcards in this deck.
Unlock Deck
k this deck
76
Which of the traits depicted here has the SMALLEST heritability?
A)trait M
B)trait H
C)trait K
D)trait L
A)trait M
B)trait H
C)trait K
D)trait L
Unlock Deck
Unlock for access to all 164 flashcards in this deck.
Unlock Deck
k this deck
77
The scatterplots show the relation between the average phenotype of parents (x-axis) and that of their offspring (y-axis) for two traits in a variety of tropical sweet corn. One trait is ear height, which has a heritability of 75%; and the other is ear length, which has a heritability of 25%. To make the axes comparable, for each trait the phenotypic measurement is expressed as a deviation from the overall mean in multiples of the standard deviation. Which of the following matchups is CORRECT?
A)Ear length is trait K and ear height is trait Q.
B)Ear length is trait Q and ear height is trait K.
C)Ear length and ear height are both trait K.
D)Ear length and ear height are both trait Q.
A)Ear length is trait K and ear height is trait Q.
B)Ear length is trait Q and ear height is trait K.
C)Ear length and ear height are both trait K.
D)Ear length and ear height are both trait Q.
Unlock Deck
Unlock for access to all 164 flashcards in this deck.
Unlock Deck
k this deck
78
When the average weight of the parents is smaller than the population mean, what is the average weight of the offspring compared with their parents? Compared with the population?
A)smaller; smaller
B)greater; greater
C)greater; smaller
D)smaller; greater
E)It is not possible to determine from the information provided.
A)smaller; smaller
B)greater; greater
C)greater; smaller
D)smaller; greater
E)It is not possible to determine from the information provided.
Unlock Deck
Unlock for access to all 164 flashcards in this deck.
Unlock Deck
k this deck
79
Regression toward the mean is observed because of:
A)correlation between genotype and environment.
B)breakdown of genotype-by-environment interaction.
C)mating between relatives.
D)segregation and recombination.
E)variable norms of reaction.
A)correlation between genotype and environment.
B)breakdown of genotype-by-environment interaction.
C)mating between relatives.
D)segregation and recombination.
E)variable norms of reaction.
Unlock Deck
Unlock for access to all 164 flashcards in this deck.
Unlock Deck
k this deck
80
Heritability is a measure of:
A)dominance.
B)epistasis.
C)concordance.
D)recombination.
E)None of the answer options is correct.
A)dominance.
B)epistasis.
C)concordance.
D)recombination.
E)None of the answer options is correct.
Unlock Deck
Unlock for access to all 164 flashcards in this deck.
Unlock Deck
k this deck
Unlock Deck
Unlock for access to all 164 flashcards in this deck.


