Deck 9: Markov Chains and the Theory of Games
Full screen (f)
Question
Determine whether the given matrix is stochastic.

A) No
B) Yes
A) No
B) Yes
Question
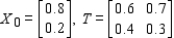
The transition matrix for a Markov process is given by State
1 2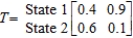 Given that the outcome state 2 has occurred, what is the probability that the next outcome of the experiment will be state 1?
A) 0.1
B) 0.4
C) 0.9
D) 0.6
1 2
Given that the outcome state 2 has occurred, what is the probability that the next outcome of the experiment will be state 1?A) 0.1
B) 0.4
C) 0.9
D) 0.6
Question
The transition matrix for a Markov process is given by State
1 2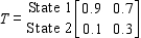 Given that the outcome state 1 has occurred, what is the probability that the next outcome of the experiment will be state 2?
A) 0.9
B) 0.1
C) 0.7
D) 0.3
1 2
Given that the outcome state 1 has occurred, what is the probability that the next outcome of the experiment will be state 2?A) 0.9
B) 0.1
C) 0.7
D) 0.3
Question
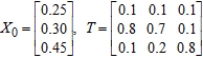
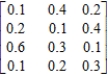
To keep track of the location of its cabs, Zephyr Cab has divided a town into three zones: zone I, zone II, and zone III. Zephyr's management has determined from company records that of the passengers picked up in zone I, 40% are discharged in the same zone, 50% are discharged in zone II, and 10% are discharged in zone III. Of those picked up in zone II, 10% are discharged in zone I, 70% are discharged in zone II, and 20% are discharged in zone III. Of those picked up in zone III, 10% are discharged in zone I, 10% are discharged in zone II, and 80% are discharged in zone III. If the initial distribution vector for the location of the taxis is 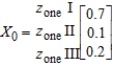
What will be the distribution after all of them have made one pickup and discharge?
A) 25% in zone I, 44% in zone II, 31% in zone III
B) 31% in zone I, 44% in zone II, 25% in zone III
C) 31% in zone I, 25% in zone II, 44% in zone III
D) 44% in zone I, 25% in zone II, 31% in zone III
What will be the distribution after all of them have made one pickup and discharge?
A) 25% in zone I, 44% in zone II, 31% in zone III
B) 31% in zone I, 44% in zone II, 25% in zone III
C) 31% in zone I, 25% in zone II, 44% in zone III
D) 44% in zone I, 25% in zone II, 31% in zone III
Question
Determine whether the given matrix is stochastic. 
A) No
B) Yes
A) No
B) Yes
Question
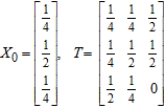
Find  (the probability distribution of the system after two observations) for the given distribution vector
  and the given transition matrix
  .
. 
A)
B)
C)
D)
E)
(the probability distribution of the system after two observations) for the given distribution vector and the given transition matrix . A)
B)
C)
D)
E)
Question
Question
Question
Find  (the probability distribution of the system after two observations) for the given distribution vector
  and the given transition matrix
  .
. 
A)
B)
C)
D)
(the probability distribution of the system after two observations) for the given distribution vector and the given transition matrix . A)
B)
C)
D)
Question
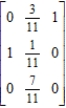
Determine whether the given matrix is stochastic. 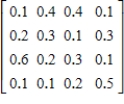
A) Yes
B) No
A) Yes
B) No
Question
Determine whether the given matrix is stochastic. 
A) Yes
B) No
A) Yes
B) No
Question
Find  (the probability distribution of the system after two observations) for the given distribution vector
  and the given transition matrix
  .
. 
A)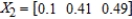
B)
C)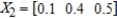
D)
(the probability distribution of the system after two observations) for the given distribution vector and the given transition matrix . A)
B)
C)
D)
Question
Determine whether the given matrix is stochastic. 
A) No
B) Yes
A) No
B) Yes
Question
Find
 (the probability distribution of the system after two observations) for the given distribution vector
  and the given transition matrix
  . (Round the answers to three decimal places.)
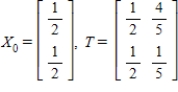
A)

B)

C)

D)

E)

Question
Determine whether the given matrix is stochastic. 
A) Yes
B) No
A) Yes
B) No
Question
Determine whether the given matrix is stochastic. 
A) Yes
B) No
A) Yes
B) No
Question
Determine whether the given matrix is stochastic. 
A) No
B) Yes
A) No
B) Yes
Question
Question
The transition matrix for a Markov process is given by State
1 2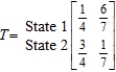 Given that the outcome state 1 has occurred, what is the probability that the next outcome of the experiment will be state 2?
A)
B)
C)
D)
E)
1 2
Given that the outcome state 1 has occurred, what is the probability that the next outcome of the experiment will be state 2?A)
B)
C)
D)
E)
Question
Find  (the probability distribution of the system after two observations) for the given distribution vector
  and the given transition matrix
  .
. 
A) 
B)
C)
D)
(the probability distribution of the system after two observations) for the given distribution vector and the given transition matrix . A)
B)
C)
D)
Question
A study conducted by the Urban Energy Commission in a large metropolitan area indicates the probabilities that homeowners within the area will use certain heating fuels or solar energy during the next 10 years as the major source of heat for their homes. The transition matrix representing the transition probabilities from one state to another is Elec.
Gas)
Oil
Solar
Electricity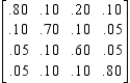 Natural gas
Fuel oil
Solar energy
Among homeowners within the area, 35% currently use electricity, 30% use natural gas, 25% use oil, and 10% use solar energy as the major source of heat for their homes. What is the expected distribution of the homeowners that will be using each type of heating fuel or solar energy within the next decade?
A) Electricity: 34 %
Natural gas: 18.5 %
Fuel oil: 11.25 %
Solar energy: 36.25 %
B) Electricity: 40 %
Natural gas: 21.5 %
Fuel oil: 14.25 %
Solar energy: 24.25 %
C) Electricity: 43 %
Natural gas: 24.5 %
Fuel oil: 17.25 %
Solar energy: 15.25 %
D) Electricity: 31 %
Natural gas: 15.5 %
Fuel oil: 8.25 %
Solar energy: 45.25 %
E) Electricity: 37 %
Natural gas: 27.5 %
Fuel oil: 20.25 %
Solar energy: 15.25 %
Gas)
Oil
Solar
Electricity
Natural gasFuel oil
Solar energy
Among homeowners within the area, 35% currently use electricity, 30% use natural gas, 25% use oil, and 10% use solar energy as the major source of heat for their homes. What is the expected distribution of the homeowners that will be using each type of heating fuel or solar energy within the next decade?
A) Electricity: 34 %
Natural gas: 18.5 %
Fuel oil: 11.25 %
Solar energy: 36.25 %
B) Electricity: 40 %
Natural gas: 21.5 %
Fuel oil: 14.25 %
Solar energy: 24.25 %
C) Electricity: 43 %
Natural gas: 24.5 %
Fuel oil: 17.25 %
Solar energy: 15.25 %
D) Electricity: 31 %
Natural gas: 15.5 %
Fuel oil: 8.25 %
Solar energy: 45.25 %
E) Electricity: 37 %
Natural gas: 27.5 %
Fuel oil: 20.25 %
Solar energy: 15.25 %
Question
Find  (the probability distribution of the system after two observations) for the distribution vector
  and the transition matrix
  .
. 
A)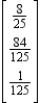
B)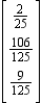
C)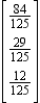
D)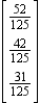
E)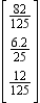
(the probability distribution of the system after two observations) for the distribution vector and the transition matrix . A)
B)
C)
D)
E)
Question
Question
To keep track of the location of its cabs, Zephyr Cab has divided a town into three zones: zone I, zone II, and zone III. Zephyr's management has determined from company records that of the passengers picked up in zone I, 40% are discharged in the same zone, 50% are discharged in zone II, and 10% are discharged in zone III. Of those picked up in zone II, 10% are discharged in zone I, 70% are discharged in zone II, and 20% are discharged in zone III. Of those picked up in zone III, 10% are discharged in zone I, 10% are discharged in zone II, and 80% are discharged in zone III. If the initial distribution vector for the location of the taxis is
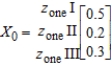
what will be the distribution after all of them have made one pickup and discharge?
__________ %
__________ %
__________ %
what will be the distribution after all of them have made one pickup and discharge?
__________ %
__________ %
__________ %
Question
Because of the continued successful implementation of an urban renewal program, it is expected that each year 5% of the population currently residing in the city will move to the suburbs and 6% of the population currently residing in the suburbs will move into the city. If the initial probability distribution is
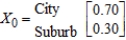
what will be the population distribution of the city after 1 year?
__________ %
After 2 years?
__________ %
Assume that the total population of the metropolitan area remains constant. Round your answers to the nearest thousandth, if necessary.
__________ %
__________ %
what will be the population distribution of the city after 1 year?
__________ %
After 2 years?
__________ %
Assume that the total population of the metropolitan area remains constant. Round your answers to the nearest thousandth, if necessary.
__________ %
__________ %
Question
At a certain university, three bookstores - the University Bookstore, the Campus Bookstore, and the Book Mart - currently serve the university community. From a survey conducted at the beginning of the fall quarter, it was found that the University Bookstore and the Campus Bookstore each had 40% of the market, whereas the Book Mart had 20% of the market. Each quarter the University Bookstore retains 80% of its customers, but loses 5% to the Campus Bookstore and 15% to the Book Mart. The Campus Bookstore retains 90% of its customers, but loses 5% to the University Bookstore and 5% to the Book Mart. The Book Mart retains 70% of its customers, but loses 5% to the University Bookstore and 25% to the Campus Bookstore.
If these trends continue, what percent of the market will each store have at the beginning of the second quarter?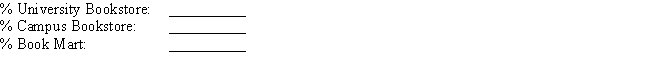 What percent of the market will each store have at the beginning of the third quarter?
If these trends continue, what percent of the market will each store have at the beginning of the second quarter?
What percent of the market will each store have at the beginning of the third quarter? Question
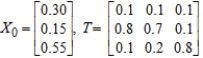
Within a large metropolitan area, 20% of the commuters currently use the public transportation system, whereas the remaining 80% commute via automobile. The city has recently revitalized and expanded its public transportation system. It is expected that 6 months from now 30% of those who are now commuting to work via automobile will switch to public transportation, and 70% will continue to commute via automobile. At the same time, it is expected that 20% of those now using public transportation will commute via automobile and 80% will continue to use public transportation.
Let denote the state "use the public transportation system" and
  denote the state "commute via automobile".
Construct the transition matrix for the Markov chain that describes the change in the mode of transportation used by these commuters.


 Find the initial distribution vector for this Markov chain.


 What percentage of the commuters are expected to use public transportation 6 months from now?
__________ %
Let
denote the state "use the public transportation system" and denote the state "commute via automobile".Construct the transition matrix for the Markov chain that describes the change in the mode of transportation used by these commuters.
Find the initial distribution vector for this Markov chain. What percentage of the commuters are expected to use public transportation 6 months from now?__________ %
Question
Because of the continued successful implementation of an urban renewal program, it is expected that each year 2% of the population currently residing in the city will move to the suburbs and 4% of the population currently residing in the suburbs will move into the city. If the initial probability distribution is 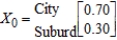
What will be the population distribution of the city after 1 year? After 2 years? Assume that the total population of the metropolitan area remains constant.
A) after 1 year: 69.8% in the city, 30.2% in the city after 2 yr: 68.1% in the city, 31.9% in the city
B) after 1 year: 69% in the city, 31% in the city after 2 yr: 69.612% in the city, 30.388% in the city
C) after 1 year: 69.8% in the city, 30.2% in the city after 2 yr: 69.612% in the city, 30.388% in the city
D) after 1 year: 69% in the city, 31% in the city after 2 yr: 68.1% in the city, 31.9% in the city
What will be the population distribution of the city after 1 year? After 2 years? Assume that the total population of the metropolitan area remains constant.
A) after 1 year: 69.8% in the city, 30.2% in the city
after 2 yr: 68.1% in the city, 31.9% in the city
B) after 1 year: 69% in the city, 31% in the city
after 2 yr: 69.612% in the city, 30.388% in the city
C) after 1 year: 69.8% in the city, 30.2% in the city
after 2 yr: 69.612% in the city, 30.388% in the city
D) after 1 year: 69% in the city, 31% in the city
after 2 yr: 68.1% in the city, 31.9% in the city
Question
Question
Determine whether the given matrix is stochastic. 
Question
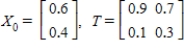
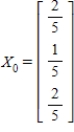
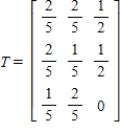
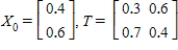
Find X2 (the probability distribution of the system after two observations) for the given distribution vector X0 and the given transition matrix T.
Question
The transition matrix for a Markov process and the initial-state distribution vector are given by
State 1 State 2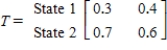 and
and
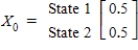 Find
Find  .
.
A)
B)
C)
D)
E)
State 1 State 2
and
Find .A)
B)
C)
D)
E)
Question
Question
Find  (the probability distribution of the system after two observations) for the given distribution vector
  and the given transition matrix
  .
.
(the probability distribution of the system after two observations) for the given distribution vector and the given transition matrix .
Question
Find X2 (the probability distribution of the system after two observations) for the distribution vector X0 and the transition matrix T.
Question
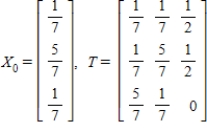
Records compiled by the admissions office at a state of university indicating the percentage of students who change their major each year are shown in the following transition matrix. Of the freshman now at the university, 20% have chosen thier major field as business, 30% in the humanities, 30% in education, and 20% in the natural sciences and other fields. Assuming that this trend continues, find the percentage of these students that will be majoring in each of the given areas in thier senior year. Hint : Find  .
.
Bus)
Hum)
Educ.
Nat) Sc. and others
Business Humanities
Education
Nat) sci. and others
A)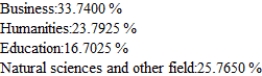
B)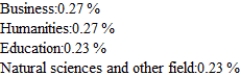
C)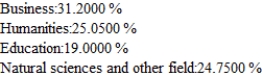
D)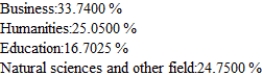
E)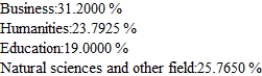
.Bus)
Hum)
Educ.
Nat) Sc. and others
Business
HumanitiesEducation
Nat) sci. and others
A)
B)
C)
D)
E)
Question
Find  (the probability distribution of the system after two observations) for the given distribution vector
  and the given transition matrix
  .
.
(the probability distribution of the system after two observations) for the given distribution vector and the given transition matrix .
Question
Question
The transition matrix for a Markov process and the initial-state distribution vector are given by State 1 State 2 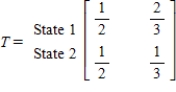 and
and 
State 1
State 2
Find .
.
A)
B)
C)
D)
E)
and State 1
State 2
Find
.A)
B)
C)
D)
E)
Question
Question
Determine whether the matrix is regular. 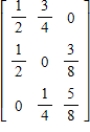
A) Regular
B) Not regular
A) Regular
B) Not regular
Question
Find the steady-state vector for the transition matrix. 
A)
B)
C)
D)
A)
B)
C)
D)
Question
Determine whether the matrix is regular. 
A) Not regular
B) Regular
A) Not regular
B) Regular
Question
Determine whether the given matrix is stochastic.
Question
Determine whether the given matrix is stochastic. 
Question
Determine whether the given matrix is stochastic.

Question
Determine whether the matrix is regular. 
A) Regular
B) Not regular
A) Regular
B) Not regular
Question
Determine whether the matrix is regular. 
A) Not regular
B) Regular
A) Not regular
B) Regular
Question
Find the steady-state vector for the transition matrix. 
A)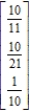
B)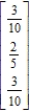
C)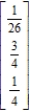
D)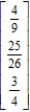
A)
B)
C)
D)
Question
Determine whether the matrix is regular. 
A) Not regular
B) Regular
A) Not regular
B) Regular
Question
Determine whether the given matrix is stochastic.

Question
Determine whether the given matrix is stochastic.

Question
Determine whether the matrix is regular. 
A) Not regular
B) Regular
A) Not regular
B) Regular
Question
Determine whether the given matrix is stochastic.

Question
Determine whether the given matrix is stochastic.

Question
Find the steady-state vector for the transition matrix. 
A)
B)
C)
D)
A)
B)
C)
D)
Question
Find the steady-state vector for the transition matrix. 
A)
B)
C)
D)
A)
B)
C)
D)
Question
Determine whether the matrix is regular. 
A) Not regular
B) Regular
A) Not regular
B) Regular
Question
Find the steady-state vector for the transition matrix. 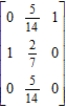
A)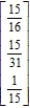
B)
C)
D)
A)
B)
C)
D)
Question
Find the steady-state vector for the transition matrix. 
A)
B)
C)
D)
A)
B)
C)
D)
Question
Question
Find the steady-state vector for the transition matrix.

Question
Question
Question
Find the steady-state vector for the transition matrix.

Question
From data collected by the Association of Realtors of a certain city, the following transition matrix was obtained. The matrix describes the buying pattern of home buyers who buy single-family homes (S) or condominiums (C) .  Currently, 75% of the homeowners live in single-family homes, whereas 25% live in condominiums. If this trend continues, what will be the percent of homeowners in this city who will own single-family homes and condominiums 2 years from now? In the long run?
Please round the answers to one decimal place.
Percentage of single-family homes owners 2 years from now is __________%
Percentage of condominiums owners 2 years from now is __________%
Percentage of single-family homes owners the long run is __________%
Percentage of condominiums owners over the long run is __________%
Currently, 75% of the homeowners live in single-family homes, whereas 25% live in condominiums. If this trend continues, what will be the percent of homeowners in this city who will own single-family homes and condominiums 2 years from now? In the long run?Please round the answers to one decimal place.
Percentage of single-family homes owners 2 years from now is __________%
Percentage of condominiums owners 2 years from now is __________%
Percentage of single-family homes owners the long run is __________%
Percentage of condominiums owners over the long run is __________%
Question
Find the steady-state vector for the transition matrix. 
A)
B)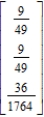
C)
D)
E)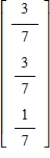
A)
B)
C)
D)
E)
Question
Find the steady-state vector for the transition matrix.

Question
Find the steady-state vector for the transition matrix.

Question
Find the steady-state vector for the transition matrix.
Question
Find the steady-state vector for the transition matrix.

Question
Question
In a study of the domestic market share of the three major automobile manufacturers  ,
,  , and
, and  in a certain country, it was found that of the customers who bought a car manufactured by
  , 75% would again buy a car manufactured by
  , 10% would buy a car manufactured by
  , and 15% would buy a car manufactured by
  . Of the customers who bought a car manufactured by
  , 90% would again buy a car manufactured by
  , whereas 5% each would buy cars manufactured by
  and
and  , respectively. Finally, of the customers who bought a car manufactured by
  , 75% would again buy a car manufactured by
  , 5% would buy a car manufactured by
  , and 20% would buy a car manufactured by
  . Assuming that these sentiments reflect the buying habits of customers in the future model years, determine the market share that will be held by each manufacturer in the long run.
Please round your answers to the nearest tenth of a percent, if necessary.
__________ % manufactured by
__________ % manufactured by
__________ % manufactured by
, , and in a certain country, it was found that of the customers who bought a car manufactured by , 75% would again buy a car manufactured by , 10% would buy a car manufactured by , and 15% would buy a car manufactured by . Of the customers who bought a car manufactured by , 90% would again buy a car manufactured by , whereas 5% each would buy cars manufactured by and , respectively. Finally, of the customers who bought a car manufactured by , 75% would again buy a car manufactured by , 5% would buy a car manufactured by , and 20% would buy a car manufactured by . Assuming that these sentiments reflect the buying habits of customers in the future model years, determine the market share that will be held by each manufacturer in the long run.
Please round your answers to the nearest tenth of a percent, if necessary.
__________ % manufactured by
__________ % manufactured by
__________ % manufactured by
Question
In a study of the domestic market share of the three major automobile manufacturers  ,
,  , and
, and  in a certain country, it was found that of the customers who bought a car manufactured by
  , 70% would again buy a car manufactured by
  , 10% would buy a car manufactured by
  , and 20% would buy a car manufactured by
  . Of the customers who bought a car manufactured by
  , 80% would again buy a car manufactured by
  , whereas 10% each would buy cars manufactured by
  and
and  , respectively. Finally, of the customers who bought a car manufactured by
  , 75% would again buy a car manufactured by
  , 5% would buy a car manufactured by
  , and 20% would buy a car manufactured by
  . Assuming that these sentiments reflect the buying habits of customers in the future model years, determine the market share that will be held by each manufacturer in the long run.
A) 44.8% manufactured by ,
,
34)5% manufactured by ,
,
20)7% manufactured by
B) 20.7% manufactured by ,
,
34)5% manufactured by ,
,
44)8% manufactured by
C) 34.5% manufactured by ,
,
44)8% manufactured by ,
,
20)7% manufactured by
D) 20.7% manufactured by ,
,
44)8% manufactured by ,
,
34)5% manufactured by
E) 44.8% manufactured by ,
,
20)7% manufactured by ,
,
34)5% manufactured by
, , and in a certain country, it was found that of the customers who bought a car manufactured by , 70% would again buy a car manufactured by , 10% would buy a car manufactured by , and 20% would buy a car manufactured by . Of the customers who bought a car manufactured by , 80% would again buy a car manufactured by , whereas 10% each would buy cars manufactured by and , respectively. Finally, of the customers who bought a car manufactured by , 75% would again buy a car manufactured by , 5% would buy a car manufactured by , and 20% would buy a car manufactured by . Assuming that these sentiments reflect the buying habits of customers in the future model years, determine the market share that will be held by each manufacturer in the long run. A) 44.8% manufactured by
,34)5% manufactured by
,20)7% manufactured by
B) 20.7% manufactured by
,34)5% manufactured by
,44)8% manufactured by
C) 34.5% manufactured by
,44)8% manufactured by
,20)7% manufactured by
D) 20.7% manufactured by
,44)8% manufactured by
,34)5% manufactured by
E) 44.8% manufactured by
,20)7% manufactured by
,34)5% manufactured by
Question
Find the steady-state vector for the transition matrix. 
A)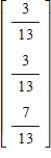
B)
C)
D)
E)
A)
B)
C)
D)
E)
Question
Question
Question
Determine whether the statement is true or false. To find the steady-state distribution vector X, we solve the system 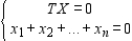
Where T is the regular stochastic matrix associated with the Markov process and

Where T is the regular stochastic matrix associated with the Markov process and
Question
Question
From data compiled over a 10-yr period by Manpower, Inc., in a statewide study of married couples in which at least one spouse was working, the following transition matrix was constructed. It gives the transitional probabilities for one and two wage earners among married couples.  At the present time, 48% of the married couples (in which at least one spouse is working) have one wage earner, and 52% have two wage earners. Assuming that this trend continues, what will be the distribution of one- and two-wage earner families among married couples in this area 10 years from now? Over the long run?
Please round the answers to one decimal place.
Percentage of one-wage earner families among married couples 10 years from now is __________%
Percentage of two-wage earner families among married couples 10 years from now is __________%
Percentage of one-wage earner families among married couples over the long run is __________%
Percentage of two-wage earner families among married couples over the long run is __________%
At the present time, 48% of the married couples (in which at least one spouse is working) have one wage earner, and 52% have two wage earners. Assuming that this trend continues, what will be the distribution of one- and two-wage earner families among married couples in this area 10 years from now? Over the long run?Please round the answers to one decimal place.
Percentage of one-wage earner families among married couples 10 years from now is __________%
Percentage of two-wage earner families among married couples 10 years from now is __________%
Percentage of one-wage earner families among married couples over the long run is __________%
Percentage of two-wage earner families among married couples over the long run is __________%

Unlock Deck
Sign up to unlock the cards in this deck!
Unlock Deck
Unlock Deck
1/203
Play
Full screen (f)
Deck 9: Markov Chains and the Theory of Games
1
Determine whether the given matrix is stochastic.
A) No
B) Yes
A) No
B) Yes
No
2
The transition matrix for a Markov process is given by State
1 2 Given that the outcome state 2 has occurred, what is the probability that the next outcome of the experiment will be state 1?
A) 0.1
B) 0.4
C) 0.9
D) 0.6
1 2
Given that the outcome state 2 has occurred, what is the probability that the next outcome of the experiment will be state 1?A) 0.1
B) 0.4
C) 0.9
D) 0.6
0.9
3
The transition matrix for a Markov process is given by State
1 2 Given that the outcome state 1 has occurred, what is the probability that the next outcome of the experiment will be state 2?
A) 0.9
B) 0.1
C) 0.7
D) 0.3
1 2
Given that the outcome state 1 has occurred, what is the probability that the next outcome of the experiment will be state 2?A) 0.9
B) 0.1
C) 0.7
D) 0.3
0.1
4
To keep track of the location of its cabs, Zephyr Cab has divided a town into three zones: zone I, zone II, and zone III. Zephyr's management has determined from company records that of the passengers picked up in zone I, 40% are discharged in the same zone, 50% are discharged in zone II, and 10% are discharged in zone III. Of those picked up in zone II, 10% are discharged in zone I, 70% are discharged in zone II, and 20% are discharged in zone III. Of those picked up in zone III, 10% are discharged in zone I, 10% are discharged in zone II, and 80% are discharged in zone III. If the initial distribution vector for the location of the taxis is
What will be the distribution after all of them have made one pickup and discharge?
A) 25% in zone I, 44% in zone II, 31% in zone III
B) 31% in zone I, 44% in zone II, 25% in zone III
C) 31% in zone I, 25% in zone II, 44% in zone III
D) 44% in zone I, 25% in zone II, 31% in zone III
What will be the distribution after all of them have made one pickup and discharge?
A) 25% in zone I, 44% in zone II, 31% in zone III
B) 31% in zone I, 44% in zone II, 25% in zone III
C) 31% in zone I, 25% in zone II, 44% in zone III
D) 44% in zone I, 25% in zone II, 31% in zone III
Unlock Deck
Unlock for access to all 203 flashcards in this deck.
Unlock Deck
k this deck
5
Determine whether the given matrix is stochastic.
A) No
B) Yes
A) No
B) Yes
Unlock Deck
Unlock for access to all 203 flashcards in this deck.
Unlock Deck
k this deck
6
Find (the probability distribution of the system after two observations) for the given distribution vector and the given transition matrix .
A)
B)
C)
D)
E)
(the probability distribution of the system after two observations) for the given distribution vector and the given transition matrix . A)
B)
C)
D)
E)
Unlock Deck
Unlock for access to all 203 flashcards in this deck.
Unlock Deck
k this deck
7
Morris Polling conducted a poll 6 months before an election in a state in which a Democrat and a Republican were running for governor and found that 80% of the voters intended to vote for the Republican and 20% intended to vote for the Democrat. In a poll conducted 3 months later, it was found that 60% of those who had earlier stated a preference for the Republican candidate still maintained that preference, whereas 40% of these voters now preferred the Democratic candidate. Of those who had earlier stated a preference for the Democrat, 70% still maintained that preference, whereas 30% now preferred the Republican candidate.
If the election were held at this time, who would win?
Assuming that this trend continues, which candidate is expected to win the election?
A) Democrat would win now, Republican after 3 months
B) Republican would win now, Democrat after 3 months
C) Democrat would win now, Democrat after 3 months
D) Republican would win now, Republican after 3 months
Unlock Deck
Unlock for access to all 203 flashcards in this deck.
Unlock Deck
k this deck
8
At the beginning of 1990, the population of a certain state was 53.2% rural and 46.8% urban. Based on past trends, it is expected that 10% of the population currently residing in the rural areas will move into the urban areas, while 16% of the population currently residing in the urban areas will move into the rural areas in the next decade. What was the population distribution in that state at the beginning of 2000?
A) 56.972% rural and 43.028% urban
B) 55.368% rural and 44.632% urban
C) 44.632% rural and 55.368% urban
D) 43.028% rural and 56.972% urban
A) 56.972% rural and 43.028% urban
B) 55.368% rural and 44.632% urban
C) 44.632% rural and 55.368% urban
D) 43.028% rural and 56.972% urban
Unlock Deck
Unlock for access to all 203 flashcards in this deck.
Unlock Deck
k this deck
9
Find (the probability distribution of the system after two observations) for the given distribution vector and the given transition matrix .
A)
B)
C)
D)
(the probability distribution of the system after two observations) for the given distribution vector and the given transition matrix . A)
B)
C)
D)
Unlock Deck
Unlock for access to all 203 flashcards in this deck.
Unlock Deck
k this deck
10
Determine whether the given matrix is stochastic.
A) Yes
B) No
A) Yes
B) No
Unlock Deck
Unlock for access to all 203 flashcards in this deck.
Unlock Deck
k this deck
11
Determine whether the given matrix is stochastic.
A) Yes
B) No
A) Yes
B) No
Unlock Deck
Unlock for access to all 203 flashcards in this deck.
Unlock Deck
k this deck
12
Find (the probability distribution of the system after two observations) for the given distribution vector and the given transition matrix .
A)
B)
C)
D)
(the probability distribution of the system after two observations) for the given distribution vector and the given transition matrix . A)
B)
C)
D)
Unlock Deck
Unlock for access to all 203 flashcards in this deck.
Unlock Deck
k this deck
13
Determine whether the given matrix is stochastic.
A) No
B) Yes
A) No
B) Yes
Unlock Deck
Unlock for access to all 203 flashcards in this deck.
Unlock Deck
k this deck
14
Find
(the probability distribution of the system after two observations) for the given distribution vector and the given transition matrix . (Round the answers to three decimal places.) A)
B)
C)
D)
E)
Unlock Deck
Unlock for access to all 203 flashcards in this deck.
Unlock Deck
k this deck
15
Determine whether the given matrix is stochastic.
A) Yes
B) No
A) Yes
B) No
Unlock Deck
Unlock for access to all 203 flashcards in this deck.
Unlock Deck
k this deck
16
Determine whether the given matrix is stochastic.
A) Yes
B) No
A) Yes
B) No
Unlock Deck
Unlock for access to all 203 flashcards in this deck.
Unlock Deck
k this deck
17
Determine whether the given matrix is stochastic.
A) No
B) Yes
A) No
B) Yes
Unlock Deck
Unlock for access to all 203 flashcards in this deck.
Unlock Deck
k this deck
18
The sum of the entries in each column of a transition matrix must not exceed 1.
Unlock Deck
Unlock for access to all 203 flashcards in this deck.
Unlock Deck
k this deck
19
The transition matrix for a Markov process is given by State
1 2 Given that the outcome state 1 has occurred, what is the probability that the next outcome of the experiment will be state 2?
A)
B)
C)
D)
E)
1 2
Given that the outcome state 1 has occurred, what is the probability that the next outcome of the experiment will be state 2?A)
B)
C)
D)
E)
Unlock Deck
Unlock for access to all 203 flashcards in this deck.
Unlock Deck
k this deck
20
Find (the probability distribution of the system after two observations) for the given distribution vector and the given transition matrix .
A)
B)
C)
D)
(the probability distribution of the system after two observations) for the given distribution vector and the given transition matrix . A)
B)
C)
D)
Unlock Deck
Unlock for access to all 203 flashcards in this deck.
Unlock Deck
k this deck
21
A study conducted by the Urban Energy Commission in a large metropolitan area indicates the probabilities that homeowners within the area will use certain heating fuels or solar energy during the next 10 years as the major source of heat for their homes. The transition matrix representing the transition probabilities from one state to another is Elec.
Gas)
Oil
Solar
Electricity Natural gas
Fuel oil
Solar energy
Among homeowners within the area, 35% currently use electricity, 30% use natural gas, 25% use oil, and 10% use solar energy as the major source of heat for their homes. What is the expected distribution of the homeowners that will be using each type of heating fuel or solar energy within the next decade?
A) Electricity: 34 %
Natural gas: 18.5 %
Fuel oil: 11.25 %
Solar energy: 36.25 %
B) Electricity: 40 %
Natural gas: 21.5 %
Fuel oil: 14.25 %
Solar energy: 24.25 %
C) Electricity: 43 %
Natural gas: 24.5 %
Fuel oil: 17.25 %
Solar energy: 15.25 %
D) Electricity: 31 %
Natural gas: 15.5 %
Fuel oil: 8.25 %
Solar energy: 45.25 %
E) Electricity: 37 %
Natural gas: 27.5 %
Fuel oil: 20.25 %
Solar energy: 15.25 %
Gas)
Oil
Solar
Electricity
Natural gasFuel oil
Solar energy
Among homeowners within the area, 35% currently use electricity, 30% use natural gas, 25% use oil, and 10% use solar energy as the major source of heat for their homes. What is the expected distribution of the homeowners that will be using each type of heating fuel or solar energy within the next decade?
A) Electricity: 34 %
Natural gas: 18.5 %
Fuel oil: 11.25 %
Solar energy: 36.25 %
B) Electricity: 40 %
Natural gas: 21.5 %
Fuel oil: 14.25 %
Solar energy: 24.25 %
C) Electricity: 43 %
Natural gas: 24.5 %
Fuel oil: 17.25 %
Solar energy: 15.25 %
D) Electricity: 31 %
Natural gas: 15.5 %
Fuel oil: 8.25 %
Solar energy: 45.25 %
E) Electricity: 37 %
Natural gas: 27.5 %
Fuel oil: 20.25 %
Solar energy: 15.25 %
Unlock Deck
Unlock for access to all 203 flashcards in this deck.
Unlock Deck
k this deck
22
Find (the probability distribution of the system after two observations) for the distribution vector and the transition matrix .
A)
B)
C)
D)
E)
(the probability distribution of the system after two observations) for the distribution vector and the transition matrix . A)
B)
C)
D)
E)
Unlock Deck
Unlock for access to all 203 flashcards in this deck.
Unlock Deck
k this deck
23
Morris Polling conducted a poll 6 months before an election in a state in which a Democrat and a Republican were running for governor and found that 70% of the voters intended to vote for the Republican and 30% intended to vote for the Democrat. In a poll conducted 3 months later, it was found that 60% of those who had earlier stated a preference for the Republican candidate still maintained that preference, whereas 40% of these voters now preferred the Democratic candidate. Of those who had earlier stated a preference for the Democrat, 70% still maintained that preference, whereas 30% now preferred the Republican candidate.
If the election were held at this time, who would win?
Assuming that this trend continues, which candidate is expected to win the election?
If the election were held at this time, who would win?
Assuming that this trend continues, which candidate is expected to win the election?
Unlock Deck
Unlock for access to all 203 flashcards in this deck.
Unlock Deck
k this deck
24
To keep track of the location of its cabs, Zephyr Cab has divided a town into three zones: zone I, zone II, and zone III. Zephyr's management has determined from company records that of the passengers picked up in zone I, 40% are discharged in the same zone, 50% are discharged in zone II, and 10% are discharged in zone III. Of those picked up in zone II, 10% are discharged in zone I, 70% are discharged in zone II, and 20% are discharged in zone III. Of those picked up in zone III, 10% are discharged in zone I, 10% are discharged in zone II, and 80% are discharged in zone III. If the initial distribution vector for the location of the taxis is
what will be the distribution after all of them have made one pickup and discharge?
__________ %
__________ %
__________ %
what will be the distribution after all of them have made one pickup and discharge?
__________ %
__________ %
__________ %
Unlock Deck
Unlock for access to all 203 flashcards in this deck.
Unlock Deck
k this deck
25
Because of the continued successful implementation of an urban renewal program, it is expected that each year 5% of the population currently residing in the city will move to the suburbs and 6% of the population currently residing in the suburbs will move into the city. If the initial probability distribution is
what will be the population distribution of the city after 1 year?
__________ %
After 2 years?
__________ %
Assume that the total population of the metropolitan area remains constant. Round your answers to the nearest thousandth, if necessary.
__________ %
__________ %
what will be the population distribution of the city after 1 year?
__________ %
After 2 years?
__________ %
Assume that the total population of the metropolitan area remains constant. Round your answers to the nearest thousandth, if necessary.
__________ %
__________ %
Unlock Deck
Unlock for access to all 203 flashcards in this deck.
Unlock Deck
k this deck
26
At a certain university, three bookstores - the University Bookstore, the Campus Bookstore, and the Book Mart - currently serve the university community. From a survey conducted at the beginning of the fall quarter, it was found that the University Bookstore and the Campus Bookstore each had 40% of the market, whereas the Book Mart had 20% of the market. Each quarter the University Bookstore retains 80% of its customers, but loses 5% to the Campus Bookstore and 15% to the Book Mart. The Campus Bookstore retains 90% of its customers, but loses 5% to the University Bookstore and 5% to the Book Mart. The Book Mart retains 70% of its customers, but loses 5% to the University Bookstore and 25% to the Campus Bookstore.
If these trends continue, what percent of the market will each store have at the beginning of the second quarter? What percent of the market will each store have at the beginning of the third quarter?
If these trends continue, what percent of the market will each store have at the beginning of the second quarter?
What percent of the market will each store have at the beginning of the third quarter? Unlock Deck
Unlock for access to all 203 flashcards in this deck.
Unlock Deck
k this deck
27
Within a large metropolitan area, 20% of the commuters currently use the public transportation system, whereas the remaining 80% commute via automobile. The city has recently revitalized and expanded its public transportation system. It is expected that 6 months from now 30% of those who are now commuting to work via automobile will switch to public transportation, and 70% will continue to commute via automobile. At the same time, it is expected that 20% of those now using public transportation will commute via automobile and 80% will continue to use public transportation.
Let denote the state "use the public transportation system" and denote the state "commute via automobile".
Construct the transition matrix for the Markov chain that describes the change in the mode of transportation used by these commuters. Find the initial distribution vector for this Markov chain. What percentage of the commuters are expected to use public transportation 6 months from now?
__________ %
Let
denote the state "use the public transportation system" and denote the state "commute via automobile".Construct the transition matrix for the Markov chain that describes the change in the mode of transportation used by these commuters.
Find the initial distribution vector for this Markov chain. What percentage of the commuters are expected to use public transportation 6 months from now?__________ %
Unlock Deck
Unlock for access to all 203 flashcards in this deck.
Unlock Deck
k this deck
28
Because of the continued successful implementation of an urban renewal program, it is expected that each year 2% of the population currently residing in the city will move to the suburbs and 4% of the population currently residing in the suburbs will move into the city. If the initial probability distribution is
What will be the population distribution of the city after 1 year? After 2 years? Assume that the total population of the metropolitan area remains constant.
A) after 1 year: 69.8% in the city, 30.2% in the city after 2 yr: 68.1% in the city, 31.9% in the city
B) after 1 year: 69% in the city, 31% in the city after 2 yr: 69.612% in the city, 30.388% in the city
C) after 1 year: 69.8% in the city, 30.2% in the city after 2 yr: 69.612% in the city, 30.388% in the city
D) after 1 year: 69% in the city, 31% in the city after 2 yr: 68.1% in the city, 31.9% in the city
What will be the population distribution of the city after 1 year? After 2 years? Assume that the total population of the metropolitan area remains constant.
A) after 1 year: 69.8% in the city, 30.2% in the city
after 2 yr: 68.1% in the city, 31.9% in the city
B) after 1 year: 69% in the city, 31% in the city
after 2 yr: 69.612% in the city, 30.388% in the city
C) after 1 year: 69.8% in the city, 30.2% in the city
after 2 yr: 69.612% in the city, 30.388% in the city
D) after 1 year: 69% in the city, 31% in the city
after 2 yr: 68.1% in the city, 31.9% in the city
Unlock Deck
Unlock for access to all 203 flashcards in this deck.
Unlock Deck
k this deck
29
Within a large metropolitan area, 20% of the commuters currently use the public transportation system, whereas the remaining 80% commute via automobile. The city has recently revitalized and expanded its public transportation system. It is expected that 6 months from now 40% of those who are now commuting to work via automobile will switch to public transportation, and 60% will continue to commute via automobile. At the same time, it is expected that 20% of those now using public transportation will commute via automobile and 80% will continue to use public transportation.
What percentage of the commuters are expected to use public transportation 6 months from now?
A) 40%
B) 48%
C) 42%
D) 46%
E) 44%
What percentage of the commuters are expected to use public transportation 6 months from now?
A) 40%
B) 48%
C) 42%
D) 46%
E) 44%
Unlock Deck
Unlock for access to all 203 flashcards in this deck.
Unlock Deck
k this deck
30
Determine whether the given matrix is stochastic.
Unlock Deck
Unlock for access to all 203 flashcards in this deck.
Unlock Deck
k this deck
31
Find X2 (the probability distribution of the system after two observations) for the given distribution vector X0 and the given transition matrix T.
Unlock Deck
Unlock for access to all 203 flashcards in this deck.
Unlock Deck
k this deck
32
The transition matrix for a Markov process and the initial-state distribution vector are given by
State 1 State 2 and
Find .
A)
B)
C)
D)
E)
State 1 State 2
and
Find .A)
B)
C)
D)
E)
Unlock Deck
Unlock for access to all 203 flashcards in this deck.
Unlock Deck
k this deck
33
At a certain university, three bookstores - the University Bookstore, the Campus Bookstore, and the Book Mart - currently serve the university community. From a survey conducted at the beginning of the fall quarter, it was found that the University Bookstore and the Campus Bookstore each had 30% of the market, whereas the Book Mart had 40% of the market. Each quarter the University Bookstore retains 80% of its customers, but loses 10% to the Campus Bookstore and 10% to the Book Mart. The Campus Bookstore retains 90% of its customers, but loses 5% to the University Bookstore and 5% to the Book Mart. The Book Mart retains 70% of its customers, but loses 10% to the University Bookstore and 20% to the Campus Bookstore.
What percent of the market will each store have at the beginning of the third quarter?
A) University Bookstore: 27.15 %
Campus Bookstore: 40.45 %
Book Mart: 32.4 %
B) University Bookstore: 27.95 %
Campus Bookstore: 41.25 %
Book Mart: 30.8 %
C) University Bookstore: 30.35 %
Campus Bookstore: 42.85 %
Book Mart: 26.8 %
D) University Bookstore: 28.75 %
Campus Bookstore: 43.65 %
Book Mart: 27.6 %
E) University Bookstore: 29.55 %
Campus Bookstore: 42.05 %
Book Mart: 28.4 %
Unlock Deck
Unlock for access to all 203 flashcards in this deck.
Unlock Deck
k this deck
34
Find (the probability distribution of the system after two observations) for the given distribution vector and the given transition matrix .
(the probability distribution of the system after two observations) for the given distribution vector and the given transition matrix .
Unlock Deck
Unlock for access to all 203 flashcards in this deck.
Unlock Deck
k this deck
35
Find X2 (the probability distribution of the system after two observations) for the distribution vector X0 and the transition matrix T.
Unlock Deck
Unlock for access to all 203 flashcards in this deck.
Unlock Deck
k this deck
36
Records compiled by the admissions office at a state of university indicating the percentage of students who change their major each year are shown in the following transition matrix. Of the freshman now at the university, 20% have chosen thier major field as business, 30% in the humanities, 30% in education, and 20% in the natural sciences and other fields. Assuming that this trend continues, find the percentage of these students that will be majoring in each of the given areas in thier senior year. Hint : Find .
Bus)
Hum)
Educ.
Nat) Sc. and others
Business Humanities
Education
Nat) sci. and others
A)
B)
C)
D)
E)
.Bus)
Hum)
Educ.
Nat) Sc. and others
Business
HumanitiesEducation
Nat) sci. and others
A)
B)
C)
D)
E)
Unlock Deck
Unlock for access to all 203 flashcards in this deck.
Unlock Deck
k this deck
37
Find (the probability distribution of the system after two observations) for the given distribution vector and the given transition matrix .
(the probability distribution of the system after two observations) for the given distribution vector and the given transition matrix .
Unlock Deck
Unlock for access to all 203 flashcards in this deck.
Unlock Deck
k this deck
38
At the beginning of 1990, the population of a certain state was 56.8% rural and 43.2% urban. Based on past trends, it is expected that 20% of the population currently residing in the rural areas will move into the urban areas, while 18% of the population currently residing in the urban areas will move into the rural areas in the next decade. What was the population distribution in that state at the beginning of 2000? Round your answers to the nearest thousandth.
__________ % rural
__________ % urban
__________ % rural
__________ % urban
Unlock Deck
Unlock for access to all 203 flashcards in this deck.
Unlock Deck
k this deck
39
The transition matrix for a Markov process and the initial-state distribution vector are given by State 1 State 2 and
State 1
State 2
Find .
A)
B)
C)
D)
E)
and State 1
State 2
Find
.A)
B)
C)
D)
E)
Unlock Deck
Unlock for access to all 203 flashcards in this deck.
Unlock Deck
k this deck
40
Determine whether the statement is true or false.
The sum of the entries in each column of a transition matrix must not exceed 1.
A) false
B) true
The sum of the entries in each column of a transition matrix must not exceed 1.
A) false
B) true
Unlock Deck
Unlock for access to all 203 flashcards in this deck.
Unlock Deck
k this deck
41
Determine whether the matrix is regular.
A) Regular
B) Not regular
A) Regular
B) Not regular
Unlock Deck
Unlock for access to all 203 flashcards in this deck.
Unlock Deck
k this deck
42
Find the steady-state vector for the transition matrix.
A)
B)
C)
D)
A)
B)
C)
D)
Unlock Deck
Unlock for access to all 203 flashcards in this deck.
Unlock Deck
k this deck
43
Determine whether the matrix is regular.
A) Not regular
B) Regular
A) Not regular
B) Regular
Unlock Deck
Unlock for access to all 203 flashcards in this deck.
Unlock Deck
k this deck
44
Determine whether the given matrix is stochastic.
Unlock Deck
Unlock for access to all 203 flashcards in this deck.
Unlock Deck
k this deck
45
Determine whether the given matrix is stochastic.
Unlock Deck
Unlock for access to all 203 flashcards in this deck.
Unlock Deck
k this deck
46
Determine whether the given matrix is stochastic.
Unlock Deck
Unlock for access to all 203 flashcards in this deck.
Unlock Deck
k this deck
47
Determine whether the matrix is regular.
A) Regular
B) Not regular
A) Regular
B) Not regular
Unlock Deck
Unlock for access to all 203 flashcards in this deck.
Unlock Deck
k this deck
48
Determine whether the matrix is regular.
A) Not regular
B) Regular
A) Not regular
B) Regular
Unlock Deck
Unlock for access to all 203 flashcards in this deck.
Unlock Deck
k this deck
49
Find the steady-state vector for the transition matrix.
A)
B)
C)
D)
A)
B)
C)
D)
Unlock Deck
Unlock for access to all 203 flashcards in this deck.
Unlock Deck
k this deck
50
Determine whether the matrix is regular.
A) Not regular
B) Regular
A) Not regular
B) Regular
Unlock Deck
Unlock for access to all 203 flashcards in this deck.
Unlock Deck
k this deck
51
Determine whether the given matrix is stochastic.
Unlock Deck
Unlock for access to all 203 flashcards in this deck.
Unlock Deck
k this deck
52
Determine whether the given matrix is stochastic.
Unlock Deck
Unlock for access to all 203 flashcards in this deck.
Unlock Deck
k this deck
53
Determine whether the matrix is regular.
A) Not regular
B) Regular
A) Not regular
B) Regular
Unlock Deck
Unlock for access to all 203 flashcards in this deck.
Unlock Deck
k this deck
54
Determine whether the given matrix is stochastic.
Unlock Deck
Unlock for access to all 203 flashcards in this deck.
Unlock Deck
k this deck
55
Determine whether the given matrix is stochastic.
Unlock Deck
Unlock for access to all 203 flashcards in this deck.
Unlock Deck
k this deck
56
Find the steady-state vector for the transition matrix.
A)
B)
C)
D)
A)
B)
C)
D)
Unlock Deck
Unlock for access to all 203 flashcards in this deck.
Unlock Deck
k this deck
57
Find the steady-state vector for the transition matrix.
A)
B)
C)
D)
A)
B)
C)
D)
Unlock Deck
Unlock for access to all 203 flashcards in this deck.
Unlock Deck
k this deck
58
Determine whether the matrix is regular.
A) Not regular
B) Regular
A) Not regular
B) Regular
Unlock Deck
Unlock for access to all 203 flashcards in this deck.
Unlock Deck
k this deck
59
Find the steady-state vector for the transition matrix.
A)
B)
C)
D)
A)
B)
C)
D)
Unlock Deck
Unlock for access to all 203 flashcards in this deck.
Unlock Deck
k this deck
60
Find the steady-state vector for the transition matrix.
A)
B)
C)
D)
A)
B)
C)
D)
Unlock Deck
Unlock for access to all 203 flashcards in this deck.
Unlock Deck
k this deck
61
A psychologist conducts an experiment in which a mouse is placed in a T-maze, where it has a choice at the T-junction of turning left and receiving a reward (cheese) or turning right and receiving a mild shock. At the end of each trial a record is kept of the mouse's response. It is observed that the mouse is as likely to turn left (state 1) as right (state 2) during the first trial. In subsequent trials, however, the observation is made that if the mouse had turned left in the previous trial, then the probability that it will turn left in the next trial is .6, whereas the probability that it will turn right is .4. If the mouse had turned right in the previous trial, then the probability that it will turn right in the next trial is .2, whereas the probability that it will turn left is .8. In the long run, what percentage of the time will the mouse turn left at the T-junction? Please round the answer to one decimal place.
A) 23.2%
B) 66.7%
C) 93.0%
D) 50.4%
A) 23.2%
B) 66.7%
C) 93.0%
D) 50.4%
Unlock Deck
Unlock for access to all 203 flashcards in this deck.
Unlock Deck
k this deck
62
Find the steady-state vector for the transition matrix.
Unlock Deck
Unlock for access to all 203 flashcards in this deck.
Unlock Deck
k this deck
63
A television poll was conducted among regular viewers of the national news in a certain region where the three national networks share the same time slot for the evening news. Results of the poll indicate that 40% of the viewers watch the ABC evening news, 40% watch the CBS evening news, and 20% watch the NBC evening news. Furthermore, it was found that of those viewers who watched the ABC evening news during 1 week, 75% would again watch the ABC evening news during the next week, 10% would watch the CBS news, and 15% would watch the NBC news. Of those viewers who watched the CBS evening news during 1 week, 80% would again watch the CBS evening news during the next week, 5% would watch the ABC news, and 15% would watch the NBC news. Of those viewers who watched the NBC evening news during 1 week, 80% would again watch the NBC news during the next week, 10% would watch ABC, and 10% would watch CBS. What share of the audience will each network command in the long run?
Please round your answers to the nearest tenth of a percent, if necessary.
__________ % would watch the ABC news
__________ % would watch the CBS news
__________ % would watch the NBC news
Please round your answers to the nearest tenth of a percent, if necessary.
__________ % would watch the ABC news
__________ % would watch the CBS news
__________ % would watch the NBC news
Unlock Deck
Unlock for access to all 203 flashcards in this deck.
Unlock Deck
k this deck
64
A psychologist conducts an experiment in which a mouse is placed in a T-maze, where it has a choice at the T-junction of turning left and receiving a reward (cheese) or turning right and receiving a mild shock. At the end of each trial a record is kept of the mouse's response. It is observed that the mouse is as likely to turn left (state 1) as right (state 2) during the first trial. In subsequent trials, however, the observation is made that if the mouse had turned left in the previous trial, then the probability that it will turn left in the next trial is .6, whereas the probability that it will turn right is .4. If the mouse had turned right in the previous trial, then the probability that it will turn right in the next trial is .2, whereas the probability that it will turn left is .8. In the long run, what percentage of the time will the mouse turn left at the T-junction? Please round the answer to one decimal place.
__________ %
__________ %
Unlock Deck
Unlock for access to all 203 flashcards in this deck.
Unlock Deck
k this deck
65
Find the steady-state vector for the transition matrix.
Unlock Deck
Unlock for access to all 203 flashcards in this deck.
Unlock Deck
k this deck
66
From data collected by the Association of Realtors of a certain city, the following transition matrix was obtained. The matrix describes the buying pattern of home buyers who buy single-family homes (S) or condominiums (C) . Currently, 75% of the homeowners live in single-family homes, whereas 25% live in condominiums. If this trend continues, what will be the percent of homeowners in this city who will own single-family homes and condominiums 2 years from now? In the long run?
Please round the answers to one decimal place.
Percentage of single-family homes owners 2 years from now is __________%
Percentage of condominiums owners 2 years from now is __________%
Percentage of single-family homes owners the long run is __________%
Percentage of condominiums owners over the long run is __________%
Currently, 75% of the homeowners live in single-family homes, whereas 25% live in condominiums. If this trend continues, what will be the percent of homeowners in this city who will own single-family homes and condominiums 2 years from now? In the long run?Please round the answers to one decimal place.
Percentage of single-family homes owners 2 years from now is __________%
Percentage of condominiums owners 2 years from now is __________%
Percentage of single-family homes owners the long run is __________%
Percentage of condominiums owners over the long run is __________%
Unlock Deck
Unlock for access to all 203 flashcards in this deck.
Unlock Deck
k this deck
67
Find the steady-state vector for the transition matrix.
A)
B)
C)
D)
E)
A)
B)
C)
D)
E)
Unlock Deck
Unlock for access to all 203 flashcards in this deck.
Unlock Deck
k this deck
68
Find the steady-state vector for the transition matrix.
Unlock Deck
Unlock for access to all 203 flashcards in this deck.
Unlock Deck
k this deck
69
Find the steady-state vector for the transition matrix.
Unlock Deck
Unlock for access to all 203 flashcards in this deck.
Unlock Deck
k this deck
70
Find the steady-state vector for the transition matrix.
Unlock Deck
Unlock for access to all 203 flashcards in this deck.
Unlock Deck
k this deck
71
Find the steady-state vector for the transition matrix.
Unlock Deck
Unlock for access to all 203 flashcards in this deck.
Unlock Deck
k this deck
72
Within a large metropolitan area, 10% of the commuters currently use the public transportation system, whereas the remaining 90% commute via automobile. The city has recently revitalized and expanded its public transportation system. It is expected that 6 months from now 10% of those who are now commuting to work via automobile will switch to public transportation, and 90% will continue to commute via automobile. At the same time, it is expected that 40% of those now using public transportation will commute via automobile, and 60% will continue to use public transportation. In the long run, what percent of the commuters will be using public transportation?
A) 30%
B) 40%
C) 35%
D) 20%
E) 25%
A) 30%
B) 40%
C) 35%
D) 20%
E) 25%
Unlock Deck
Unlock for access to all 203 flashcards in this deck.
Unlock Deck
k this deck
73
In a study of the domestic market share of the three major automobile manufacturers , , and in a certain country, it was found that of the customers who bought a car manufactured by , 75% would again buy a car manufactured by , 10% would buy a car manufactured by , and 15% would buy a car manufactured by . Of the customers who bought a car manufactured by , 90% would again buy a car manufactured by , whereas 5% each would buy cars manufactured by and , respectively. Finally, of the customers who bought a car manufactured by , 75% would again buy a car manufactured by , 5% would buy a car manufactured by , and 20% would buy a car manufactured by . Assuming that these sentiments reflect the buying habits of customers in the future model years, determine the market share that will be held by each manufacturer in the long run.
Please round your answers to the nearest tenth of a percent, if necessary.
__________ % manufactured by
__________ % manufactured by
__________ % manufactured by
, , and in a certain country, it was found that of the customers who bought a car manufactured by , 75% would again buy a car manufactured by , 10% would buy a car manufactured by , and 15% would buy a car manufactured by . Of the customers who bought a car manufactured by , 90% would again buy a car manufactured by , whereas 5% each would buy cars manufactured by and , respectively. Finally, of the customers who bought a car manufactured by , 75% would again buy a car manufactured by , 5% would buy a car manufactured by , and 20% would buy a car manufactured by . Assuming that these sentiments reflect the buying habits of customers in the future model years, determine the market share that will be held by each manufacturer in the long run.
Please round your answers to the nearest tenth of a percent, if necessary.
__________ % manufactured by
__________ % manufactured by
__________ % manufactured by
Unlock Deck
Unlock for access to all 203 flashcards in this deck.
Unlock Deck
k this deck
74
In a study of the domestic market share of the three major automobile manufacturers , , and in a certain country, it was found that of the customers who bought a car manufactured by , 70% would again buy a car manufactured by , 10% would buy a car manufactured by , and 20% would buy a car manufactured by . Of the customers who bought a car manufactured by , 80% would again buy a car manufactured by , whereas 10% each would buy cars manufactured by and , respectively. Finally, of the customers who bought a car manufactured by , 75% would again buy a car manufactured by , 5% would buy a car manufactured by , and 20% would buy a car manufactured by . Assuming that these sentiments reflect the buying habits of customers in the future model years, determine the market share that will be held by each manufacturer in the long run.
A) 44.8% manufactured by ,
34)5% manufactured by ,
20)7% manufactured by
B) 20.7% manufactured by ,
34)5% manufactured by ,
44)8% manufactured by
C) 34.5% manufactured by ,
44)8% manufactured by ,
20)7% manufactured by
D) 20.7% manufactured by ,
44)8% manufactured by ,
34)5% manufactured by
E) 44.8% manufactured by ,
20)7% manufactured by ,
34)5% manufactured by
, , and in a certain country, it was found that of the customers who bought a car manufactured by , 70% would again buy a car manufactured by , 10% would buy a car manufactured by , and 20% would buy a car manufactured by . Of the customers who bought a car manufactured by , 80% would again buy a car manufactured by , whereas 10% each would buy cars manufactured by and , respectively. Finally, of the customers who bought a car manufactured by , 75% would again buy a car manufactured by , 5% would buy a car manufactured by , and 20% would buy a car manufactured by . Assuming that these sentiments reflect the buying habits of customers in the future model years, determine the market share that will be held by each manufacturer in the long run. A) 44.8% manufactured by
,34)5% manufactured by
,20)7% manufactured by
B) 20.7% manufactured by
,34)5% manufactured by
,44)8% manufactured by
C) 34.5% manufactured by
,44)8% manufactured by
,20)7% manufactured by
D) 20.7% manufactured by
,44)8% manufactured by
,34)5% manufactured by
E) 44.8% manufactured by
,20)7% manufactured by
,34)5% manufactured by
Unlock Deck
Unlock for access to all 203 flashcards in this deck.
Unlock Deck
k this deck
75
Find the steady-state vector for the transition matrix.
A)
B)
C)
D)
E)
A)
B)
C)
D)
E)
Unlock Deck
Unlock for access to all 203 flashcards in this deck.
Unlock Deck
k this deck
76
Within a large metropolitan area, 15% of the commuters currently use the public transportation system, whereas the remaining 85% commute via automobile. The city has recently revitalized and expanded its public transportation system. It is expected that 6 months from now 10% of those who are now commuting to work via automobile will switch to public transportation, and 90% will continue to commute via automobile. At the same time, it is expected that 40% of those now using public transportation will commute via automobile, and 60% will continue to use public transportation. In the long run, what percent of the commuters will be using public transportation?
__________ %
__________ %
Unlock Deck
Unlock for access to all 203 flashcards in this deck.
Unlock Deck
k this deck
77
Within a large metropolitian area, 20% of the commuters currently use the public transportation system, whereas the remaining 80% commute via automobile. The city recently revitalized and expanded its public transportation system. It is expected that 6 months from now, 20% of those who are now commuting to work via autombile will switch to public transportaion, and 80% will continue to commute via automobile. At the same time, it is expected that 70% of those now using public transportation will commute via automobile, and 30% will continue to use public transportation. In the long run, what percentage of commuters will be using public transportation?
A) 22%
B) 15%
C) 83%
D) 16%
E) 70%
A) 22%
B) 15%
C) 83%
D) 16%
E) 70%
Unlock Deck
Unlock for access to all 203 flashcards in this deck.
Unlock Deck
k this deck
78
Determine whether the statement is true or false. To find the steady-state distribution vector X, we solve the system
Where T is the regular stochastic matrix associated with the Markov process and
Where T is the regular stochastic matrix associated with the Markov process and
Unlock Deck
Unlock for access to all 203 flashcards in this deck.
Unlock Deck
k this deck
79
A television poll was conducted among regular viewers of the national news in a certain region where the three national networks share the same time slot for the evening news. Results of the poll indicate that 40% of the viewers watch the ABC evening news, 40% watch the CBS evening news, and 20% watch the NBC evening news. Furthermore, it was found that of those viewers who watched the ABC evening news during 1 week, 75% would again watch the ABC evening news during the next week, 10% would watch the CBS news, and 15% would watch the NBC news. Of those viewers who watched the CBS evening news during 1 week, 75% would again watch the CBS evening news during the next week, 5% would watch the ABC news, and 20% would watch the NBC news. Of those viewers who watched the NBC evening news during 1 week, 85% would again watch the NBC news during the next week, 10% would watch ABC, and 5% would watch CBS. What share of the audience will each network command in the long run?
A) 53.5% would watch ABC,
20)9% would watch CBS,
25)6% would watch NBC
B) 25.6% would watch ABC,
20)9% would watch CBS,
53)5% would watch NBC
C) 20.9% would watch ABC,
25)6% would watch CBS,
53)5% would watch NBC
D) 20.9% would watch ABC,
53)5% would watch CBS,
25)6% would watch NBC
E) 25.6% would watch ABC,
53)5% would watch CBS,
20)9% would watch NBC
Unlock Deck
Unlock for access to all 203 flashcards in this deck.
Unlock Deck
k this deck
80
From data compiled over a 10-yr period by Manpower, Inc., in a statewide study of married couples in which at least one spouse was working, the following transition matrix was constructed. It gives the transitional probabilities for one and two wage earners among married couples. At the present time, 48% of the married couples (in which at least one spouse is working) have one wage earner, and 52% have two wage earners. Assuming that this trend continues, what will be the distribution of one- and two-wage earner families among married couples in this area 10 years from now? Over the long run?
Please round the answers to one decimal place.
Percentage of one-wage earner families among married couples 10 years from now is __________%
Percentage of two-wage earner families among married couples 10 years from now is __________%
Percentage of one-wage earner families among married couples over the long run is __________%
Percentage of two-wage earner families among married couples over the long run is __________%
At the present time, 48% of the married couples (in which at least one spouse is working) have one wage earner, and 52% have two wage earners. Assuming that this trend continues, what will be the distribution of one- and two-wage earner families among married couples in this area 10 years from now? Over the long run?Please round the answers to one decimal place.
Percentage of one-wage earner families among married couples 10 years from now is __________%
Percentage of two-wage earner families among married couples 10 years from now is __________%
Percentage of one-wage earner families among married couples over the long run is __________%
Percentage of two-wage earner families among married couples over the long run is __________%
Unlock Deck
Unlock for access to all 203 flashcards in this deck.
Unlock Deck
k this deck
Unlock Deck
Unlock for access to all 203 flashcards in this deck.


