Deck 14: Forecasting
Full screen (f)
Question
Question
Question
Question
Question
Question
Question
Question
Question
Question
Question
Question
Question
Question
Question
Question
Question
Question
Question
Question
Question
Question
Question
Question
Question
Question
Question
Question
Question
Question
Question
Question
Question
Question
Question
Question
Question
Question
Question
Question
Question
Table 14.1
The Agricultural Extension Agent's Office has tracked fertilizer application and crop yields for a variety of chickpea and has recorded the data shown in the following table.Their staff statistician developed the regression model and computed the performance statistics displayed below the data.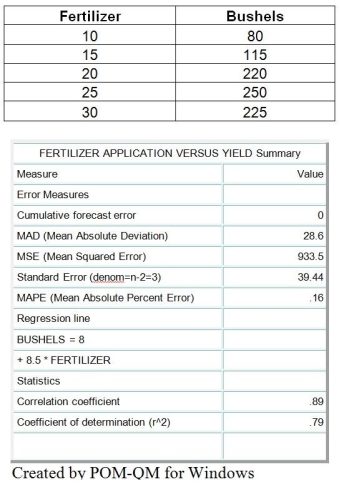
Use the information provided in Table 14.1.The value of Fertilizer required to generate 100 bushels yield must be:
A)10.82.
B)12.25.
C)10.26.
D)9.07.
Question
Table 14.2
A textbook publisher for books used in business schools believes that the number of books sold is related to the number of campus visits to decision makers made by their sales force.A sampling of the number of sales calls made and the number of books sold is shown in the following table.
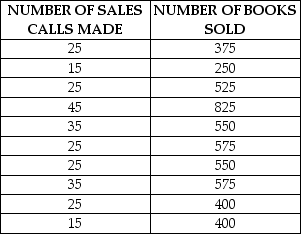
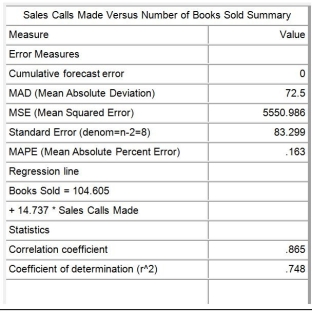
Use the information provided in Table 14.2.What percent in the variation of the variable Books Sold is explained by the value of the variable Sales Calls Made?
A)86.5%
B)83.3%
C)74.8%
D)72.5%
A textbook publisher for books used in business schools believes that the number of books sold is related to the number of campus visits to decision makers made by their sales force.A sampling of the number of sales calls made and the number of books sold is shown in the following table.
Use the information provided in Table 14.2.What percent in the variation of the variable Books Sold is explained by the value of the variable Sales Calls Made?
A)86.5%
B)83.3%
C)74.8%
D)72.5%
Question
Question
Question
Table 14.1
The Agricultural Extension Agent's Office has tracked fertilizer application and crop yields for a variety of chickpea and has recorded the data shown in the following table.Their staff statistician developed the regression model and computed the performance statistics displayed below the data.
Use the information provided in Table 14.1.The value of Bushels when Fertilizer is 60 is:
A)2520.
B)490.
C)390.
D)518.
Question
Question
Question
Question
Question
Question
Question
Table 14.2
A textbook publisher for books used in business schools believes that the number of books sold is related to the number of campus visits to decision makers made by their sales force.A sampling of the number of sales calls made and the number of books sold is shown in the following table.
Use the information provided in Table 14.2.For every sale call made,the number of books sold increases by:
A)14.74 books.
B)104.6 books.
C)83.30 books.
D)7.25 books.
Question
Table 14.1
The Agricultural Extension Agent's Office has tracked fertilizer application and crop yields for a variety of chickpea and has recorded the data shown in the following table.Their staff statistician developed the regression model and computed the performance statistics displayed below the data.
Use the information provided in Table 14.1.For every unit of fertilizer applied,the crop yield increases by:
A)8.0 bushels.
B)8.5 bushels.
C)8.9 bushels.
D)7.9 bushels.
Question
Table 14.1
The Agricultural Extension Agent's Office has tracked fertilizer application and crop yields for a variety of chickpea and has recorded the data shown in the following table.Their staff statistician developed the regression model and computed the performance statistics displayed below the data.
Use the information provided in Table 14.1.What percent in the variation of the variable Bushels is explained by the value of the variable Fertilizer?
A)89%
B)79%
C)71%
D)50%
Question
Question
Question
Table 14.1
The Agricultural Extension Agent's Office has tracked fertilizer application and crop yields for a variety of chickpea and has recorded the data shown in the following table.Their staff statistician developed the regression model and computed the performance statistics displayed below the data.
Use the information in Table 14.1.If the correlation coefficient were negative,what would also be true?
A)The coefficient of determination would also be negative.
B)An increase in fertilizer would result in a decrease in crop yield.
C)Applying no fertilizer would mean a negative crop yield.
D)The standard error would also be negative.
Question
Question
Question
Question
Table 14.4
The Furniture Super Mart is a furniture retailer in Evansville,Indiana.The Marketing Manager wants to prepare a media budget based on the next quarter's business plan.The manager wants to decide the mix of radio advertising and newspaper advertising needed to generate varying levels of Weekly Gross Revenue.The manager has collected data for the past five weeks,and has recorded the following average Weekly Gross Revenues and expenditures for Weekly Radio (X1)and Newspaper (X2)advertising:
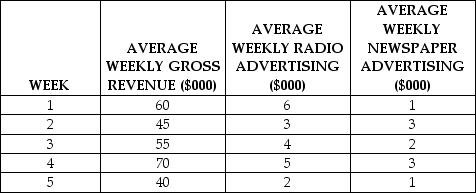 The Manager uses the multiple regression model in OM Explorer and obtains the following results:
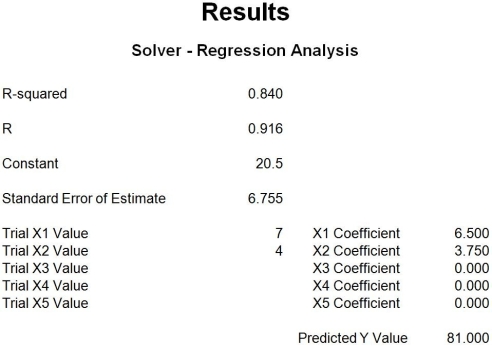
Use the information provided in Table 14.4.What is the estimated Weekly Gross Revenue if $7,000 is spent on Radio Advertising (X1)and $4,000 is spent on Newspaper Advertising (X2)?
A)$45,500
B)$15,000
C)$60,500
D)$81,000
The Furniture Super Mart is a furniture retailer in Evansville,Indiana.The Marketing Manager wants to prepare a media budget based on the next quarter's business plan.The manager wants to decide the mix of radio advertising and newspaper advertising needed to generate varying levels of Weekly Gross Revenue.The manager has collected data for the past five weeks,and has recorded the following average Weekly Gross Revenues and expenditures for Weekly Radio (X1)and Newspaper (X2)advertising:
The Manager uses the multiple regression model in OM Explorer and obtains the following results: Use the information provided in Table 14.4.What is the estimated Weekly Gross Revenue if $7,000 is spent on Radio Advertising (X1)and $4,000 is spent on Newspaper Advertising (X2)?
A)$45,500
B)$15,000
C)$60,500
D)$81,000
Question
Question
Table 14.2
A textbook publisher for books used in business schools believes that the number of books sold is related to the number of campus visits to decision makers made by their sales force.A sampling of the number of sales calls made and the number of books sold is shown in the following table.
Use the information provided in Table 14.2.If a sales representative makes 55 sales calls,the number of book sales the publisher should expect is:
A)105.
B)4,581.
C)114.
D)915.
Question
Table 14.3
Columbia Appliance sells and delivers appliances in the Columbia,South Carolina area.The Operations and Supply Chain Manager wants to be able to predict the delivery crew's hours for easier scheduling.The delivery crew,consisting of a truck and two workers,must load the truck each day and then drive the truck to various locations to deliver appliances.Variables each day include miles driven and the number of deliveries made.The manager has collected data for the past five weeks,and has recorded the following average daily crew hours worked,miles driven and deliveries made:
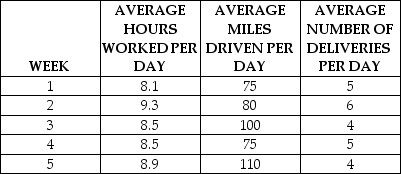 The manager uses the multiple regression model in POM for Windows and obtains the following results:
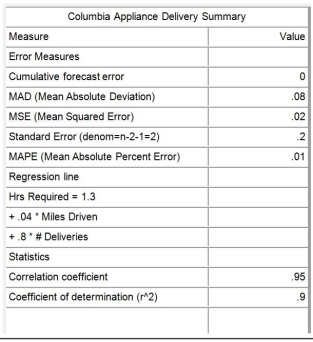
Use the information provided in Table 14.3.If 10 extra miles of driving is added to the crew's daily work,how much time is added to their work schedule for that day? (Assume all other variables are held constant. )
A)30 minutes
B)2.4 minutes
C)24 minutes
D)48 minutes
Columbia Appliance sells and delivers appliances in the Columbia,South Carolina area.The Operations and Supply Chain Manager wants to be able to predict the delivery crew's hours for easier scheduling.The delivery crew,consisting of a truck and two workers,must load the truck each day and then drive the truck to various locations to deliver appliances.Variables each day include miles driven and the number of deliveries made.The manager has collected data for the past five weeks,and has recorded the following average daily crew hours worked,miles driven and deliveries made:
The manager uses the multiple regression model in POM for Windows and obtains the following results: Use the information provided in Table 14.3.If 10 extra miles of driving is added to the crew's daily work,how much time is added to their work schedule for that day? (Assume all other variables are held constant. )
A)30 minutes
B)2.4 minutes
C)24 minutes
D)48 minutes
Question
Table 14.2
A textbook publisher for books used in business schools believes that the number of books sold is related to the number of campus visits to decision makers made by their sales force.A sampling of the number of sales calls made and the number of books sold is shown in the following table.
Use the information provided in Table 14.2.In order to realize the sale of 700 books,how many sales calls will the sales representative have to make?
A)40.4
B)45.9
C)32.7
D)37.6
Question
Question
Table 14.4
The Furniture Super Mart is a furniture retailer in Evansville,Indiana.The Marketing Manager wants to prepare a media budget based on the next quarter's business plan.The manager wants to decide the mix of radio advertising and newspaper advertising needed to generate varying levels of Weekly Gross Revenue.The manager has collected data for the past five weeks,and has recorded the following average Weekly Gross Revenues and expenditures for Weekly Radio (X1)and Newspaper (X2)advertising:
The Manager uses the multiple regression model in OM Explorer and obtains the following results:
Use the information provided in Table 14.4.Adding $1,000 of Weekly Radio Advertising (X1)can be expected to increase Weekly Gross Revenues by what amount? (Assume all other variables are held constant. )
A)$20,500
B)$3,750
C)$6,500
D)$10,250
The Furniture Super Mart is a furniture retailer in Evansville,Indiana.The Marketing Manager wants to prepare a media budget based on the next quarter's business plan.The manager wants to decide the mix of radio advertising and newspaper advertising needed to generate varying levels of Weekly Gross Revenue.The manager has collected data for the past five weeks,and has recorded the following average Weekly Gross Revenues and expenditures for Weekly Radio (X1)and Newspaper (X2)advertising:
The Manager uses the multiple regression model in OM Explorer and obtains the following results: Use the information provided in Table 14.4.Adding $1,000 of Weekly Radio Advertising (X1)can be expected to increase Weekly Gross Revenues by what amount? (Assume all other variables are held constant. )
A)$20,500
B)$3,750
C)$6,500
D)$10,250
Question
Table 14.4
The Furniture Super Mart is a furniture retailer in Evansville,Indiana.The Marketing Manager wants to prepare a media budget based on the next quarter's business plan.The manager wants to decide the mix of radio advertising and newspaper advertising needed to generate varying levels of Weekly Gross Revenue.The manager has collected data for the past five weeks,and has recorded the following average Weekly Gross Revenues and expenditures for Weekly Radio (X1)and Newspaper (X2)advertising:
The Manager uses the multiple regression model in OM Explorer and obtains the following results:
Use the information provided in Table 14.4.Adding $1,000 of Weekly Newspaper Advertising (X2)can be expected to increase Weekly Gross Revenues by what amount? (Assume all other variables are held constant. )
A)$20,500
B)$3,750
C)$6,500
D)$10,250
The Furniture Super Mart is a furniture retailer in Evansville,Indiana.The Marketing Manager wants to prepare a media budget based on the next quarter's business plan.The manager wants to decide the mix of radio advertising and newspaper advertising needed to generate varying levels of Weekly Gross Revenue.The manager has collected data for the past five weeks,and has recorded the following average Weekly Gross Revenues and expenditures for Weekly Radio (X1)and Newspaper (X2)advertising:
The Manager uses the multiple regression model in OM Explorer and obtains the following results: Use the information provided in Table 14.4.Adding $1,000 of Weekly Newspaper Advertising (X2)can be expected to increase Weekly Gross Revenues by what amount? (Assume all other variables are held constant. )
A)$20,500
B)$3,750
C)$6,500
D)$10,250
Question
Table 14.4
The Furniture Super Mart is a furniture retailer in Evansville,Indiana.The Marketing Manager wants to prepare a media budget based on the next quarter's business plan.The manager wants to decide the mix of radio advertising and newspaper advertising needed to generate varying levels of Weekly Gross Revenue.The manager has collected data for the past five weeks,and has recorded the following average Weekly Gross Revenues and expenditures for Weekly Radio (X1)and Newspaper (X2)advertising:
The Manager uses the multiple regression model in OM Explorer and obtains the following results:
Use the information provided in Table 14.4.What is the estimated Weekly Gross Revenue if $4,000 is spent on Radio Advertising (X1)and $7,000 is spent on Newspaper Advertising (X2)?
A)$52,250
B)$26,250
C)$72,750
D)$20,500
The Furniture Super Mart is a furniture retailer in Evansville,Indiana.The Marketing Manager wants to prepare a media budget based on the next quarter's business plan.The manager wants to decide the mix of radio advertising and newspaper advertising needed to generate varying levels of Weekly Gross Revenue.The manager has collected data for the past five weeks,and has recorded the following average Weekly Gross Revenues and expenditures for Weekly Radio (X1)and Newspaper (X2)advertising:
The Manager uses the multiple regression model in OM Explorer and obtains the following results: Use the information provided in Table 14.4.What is the estimated Weekly Gross Revenue if $4,000 is spent on Radio Advertising (X1)and $7,000 is spent on Newspaper Advertising (X2)?
A)$52,250
B)$26,250
C)$72,750
D)$20,500
Question
Question
Question
Question
Question
Table 14.3
Columbia Appliance sells and delivers appliances in the Columbia,South Carolina area.The Operations and Supply Chain Manager wants to be able to predict the delivery crew's hours for easier scheduling.The delivery crew,consisting of a truck and two workers,must load the truck each day and then drive the truck to various locations to deliver appliances.Variables each day include miles driven and the number of deliveries made.The manager has collected data for the past five weeks,and has recorded the following average daily crew hours worked,miles driven and deliveries made:
The manager uses the multiple regression model in POM for Windows and obtains the following results:
Use the information provided in Table 14.3.If one delivery is added to the crew's daily work,how much time is added to their work schedule for that day? (Assume all other variables are held constant. )
A)30 minutes
B)2.4 minutes
C)24 minutes
D)48 minutes
Columbia Appliance sells and delivers appliances in the Columbia,South Carolina area.The Operations and Supply Chain Manager wants to be able to predict the delivery crew's hours for easier scheduling.The delivery crew,consisting of a truck and two workers,must load the truck each day and then drive the truck to various locations to deliver appliances.Variables each day include miles driven and the number of deliveries made.The manager has collected data for the past five weeks,and has recorded the following average daily crew hours worked,miles driven and deliveries made:
The manager uses the multiple regression model in POM for Windows and obtains the following results: Use the information provided in Table 14.3.If one delivery is added to the crew's daily work,how much time is added to their work schedule for that day? (Assume all other variables are held constant. )
A)30 minutes
B)2.4 minutes
C)24 minutes
D)48 minutes
Question
Question
Question
Table 14.4
The Furniture Super Mart is a furniture retailer in Evansville,Indiana.The Marketing Manager wants to prepare a media budget based on the next quarter's business plan.The manager wants to decide the mix of radio advertising and newspaper advertising needed to generate varying levels of Weekly Gross Revenue.The manager has collected data for the past five weeks,and has recorded the following average Weekly Gross Revenues and expenditures for Weekly Radio (X1)and Newspaper (X2)advertising:
The Manager uses the multiple regression model in OM Explorer and obtains the following results:
Use the information provided in Table 14.4.What amount of Weekly Gross Revenue can be expected for a week in which no radio or newspaper advertising is purchased? (Assume all other variables are held constant. )
A)$20,500
B)$3,750
C)$6,500
D)$10,250
The Furniture Super Mart is a furniture retailer in Evansville,Indiana.The Marketing Manager wants to prepare a media budget based on the next quarter's business plan.The manager wants to decide the mix of radio advertising and newspaper advertising needed to generate varying levels of Weekly Gross Revenue.The manager has collected data for the past five weeks,and has recorded the following average Weekly Gross Revenues and expenditures for Weekly Radio (X1)and Newspaper (X2)advertising:
The Manager uses the multiple regression model in OM Explorer and obtains the following results: Use the information provided in Table 14.4.What amount of Weekly Gross Revenue can be expected for a week in which no radio or newspaper advertising is purchased? (Assume all other variables are held constant. )
A)$20,500
B)$3,750
C)$6,500
D)$10,250
Question
Table 14.3
Columbia Appliance sells and delivers appliances in the Columbia,South Carolina area.The Operations and Supply Chain Manager wants to be able to predict the delivery crew's hours for easier scheduling.The delivery crew,consisting of a truck and two workers,must load the truck each day and then drive the truck to various locations to deliver appliances.Variables each day include miles driven and the number of deliveries made.The manager has collected data for the past five weeks,and has recorded the following average daily crew hours worked,miles driven and deliveries made:
The manager uses the multiple regression model in POM for Windows and obtains the following results:
Use the information provided in Table 14.3.What is the estimated work time for the crew if the schedule that day calls for 85 driving miles and 6 deliveries?
A)8.1 hours
B)9.2 hours
C)8.9 hours
D)9.5 hours
Columbia Appliance sells and delivers appliances in the Columbia,South Carolina area.The Operations and Supply Chain Manager wants to be able to predict the delivery crew's hours for easier scheduling.The delivery crew,consisting of a truck and two workers,must load the truck each day and then drive the truck to various locations to deliver appliances.Variables each day include miles driven and the number of deliveries made.The manager has collected data for the past five weeks,and has recorded the following average daily crew hours worked,miles driven and deliveries made:
The manager uses the multiple regression model in POM for Windows and obtains the following results: Use the information provided in Table 14.3.What is the estimated work time for the crew if the schedule that day calls for 85 driving miles and 6 deliveries?
A)8.1 hours
B)9.2 hours
C)8.9 hours
D)9.5 hours
Question
Question
Table 14.3
Columbia Appliance sells and delivers appliances in the Columbia,South Carolina area.The Operations and Supply Chain Manager wants to be able to predict the delivery crew's hours for easier scheduling.The delivery crew,consisting of a truck and two workers,must load the truck each day and then drive the truck to various locations to deliver appliances.Variables each day include miles driven and the number of deliveries made.The manager has collected data for the past five weeks,and has recorded the following average daily crew hours worked,miles driven and deliveries made:
The manager uses the multiple regression model in POM for Windows and obtains the following results:
Use the information provided in Table 14.3.What is the estimated work time for the crew if the schedule that day calls for 90 driving miles and 4 deliveries?
A)8.1 hours
B)9.2 hours
C)8.9 hours
D)8.5 hours
Columbia Appliance sells and delivers appliances in the Columbia,South Carolina area.The Operations and Supply Chain Manager wants to be able to predict the delivery crew's hours for easier scheduling.The delivery crew,consisting of a truck and two workers,must load the truck each day and then drive the truck to various locations to deliver appliances.Variables each day include miles driven and the number of deliveries made.The manager has collected data for the past five weeks,and has recorded the following average daily crew hours worked,miles driven and deliveries made:
The manager uses the multiple regression model in POM for Windows and obtains the following results: Use the information provided in Table 14.3.What is the estimated work time for the crew if the schedule that day calls for 90 driving miles and 4 deliveries?
A)8.1 hours
B)9.2 hours
C)8.9 hours
D)8.5 hours

Unlock Deck
Sign up to unlock the cards in this deck!
Unlock Deck
Unlock Deck
1/183
Play
Full screen (f)
Deck 14: Forecasting
1
The repeated observations of demand for a product or service in their order of occurrence form a pattern known as a time series.
True
2
Aggregating products or services together generally decreases the forecast accuracy.
False
3
Market research is a systematic approach to determine consumer interest by gaining consensus from a group of experts while maintaining their anonymity.
False
4
Time-series analysis is a statistical approach that relies heavily on historical demand data to project the future size of demand.
Unlock Deck
Unlock for access to all 183 flashcards in this deck.
Unlock Deck
k this deck
5
A linear regression model results in the equation Y = 15 - 23X.If the coefficient of determination is a perfect 1.0,the correlation coefficient must be -1.
Unlock Deck
Unlock for access to all 183 flashcards in this deck.
Unlock Deck
k this deck
6
The closer the value of the sample correlation coefficient is to -1.00,the worse the predictive ability of the independent variable for the dependent variable.
Unlock Deck
Unlock for access to all 183 flashcards in this deck.
Unlock Deck
k this deck
7
The Delphi method is a process of gaining consensus from a group of experts by debate and voting throughout several rounds of group discussion led by a moderator.
Unlock Deck
Unlock for access to all 183 flashcards in this deck.
Unlock Deck
k this deck
8
Regression equations with a coefficient of determination close to zero are extremely accurate because they have little forecast error.
Unlock Deck
Unlock for access to all 183 flashcards in this deck.
Unlock Deck
k this deck
9
Salesforce estimates are extremely useful for technological forecasting.
Unlock Deck
Unlock for access to all 183 flashcards in this deck.
Unlock Deck
k this deck
10
The causal method of forecasting uses historical data on independent variables (such as promotional campaigns and economic conditions)to predict the demand of dependent variables (such as sales volume).
Unlock Deck
Unlock for access to all 183 flashcards in this deck.
Unlock Deck
k this deck
11
Judgment methods of forecasting should never be used with quantitative forecasting methods.
Unlock Deck
Unlock for access to all 183 flashcards in this deck.
Unlock Deck
k this deck
12
Technological forecasting is an application of executive opinion in light of the difficulties in keeping abreast of the latest advances in technology.
Unlock Deck
Unlock for access to all 183 flashcards in this deck.
Unlock Deck
k this deck
13
The standard error of the estimate measures how closely the data on the independent variable cluster around the regression line.
Unlock Deck
Unlock for access to all 183 flashcards in this deck.
Unlock Deck
k this deck
14
A naive forecast is a time-series method whereby the forecast for the next period equals the demand for the current period.
Unlock Deck
Unlock for access to all 183 flashcards in this deck.
Unlock Deck
k this deck
15
Judgment methods of forecasting are quantitative methods that use historical data on independent variables to predict demand.
Unlock Deck
Unlock for access to all 183 flashcards in this deck.
Unlock Deck
k this deck
16
One of the basic time series patterns is random.
Unlock Deck
Unlock for access to all 183 flashcards in this deck.
Unlock Deck
k this deck
17
Time-series forecasts require information about only the dependent variable.
Unlock Deck
Unlock for access to all 183 flashcards in this deck.
Unlock Deck
k this deck
18
The larger the slope of the regression line,the more accurate the regression forecast.
Unlock Deck
Unlock for access to all 183 flashcards in this deck.
Unlock Deck
k this deck
19
Aggregation is the act of clustering several similar products or services.
Unlock Deck
Unlock for access to all 183 flashcards in this deck.
Unlock Deck
k this deck
20
Random variation is an aspect of demand that increases the accuracy of the forecast.
Unlock Deck
Unlock for access to all 183 flashcards in this deck.
Unlock Deck
k this deck
21
Combination forecasting is a method of forecasting that selects the best from a group of forecasts generated by simple techniques.
Unlock Deck
Unlock for access to all 183 flashcards in this deck.
Unlock Deck
k this deck
22
Combination forecasting is most effective when the techniques being combined contribute different kinds of information to the forecasting process.
Unlock Deck
Unlock for access to all 183 flashcards in this deck.
Unlock Deck
k this deck
23
There are historically three 32-month periods of generally rising prices in the stock market for every one 9-month period of falling prices.This observation leads you to conclude that the stock market exhibits a:
A)random pattern.
B)trend pattern
C)seasonal pattern.
D)cyclical pattern.
A)random pattern.
B)trend pattern
C)seasonal pattern.
D)cyclical pattern.
Unlock Deck
Unlock for access to all 183 flashcards in this deck.
Unlock Deck
k this deck
24
A regression equation with a coefficient of determination near one would be most likely to occur when the data demonstrated a:
A)seasonal demand pattern.
B)trend demand pattern.
C)cyclical demand pattern.
D)random demand pattern.
A)seasonal demand pattern.
B)trend demand pattern.
C)cyclical demand pattern.
D)random demand pattern.
Unlock Deck
Unlock for access to all 183 flashcards in this deck.
Unlock Deck
k this deck
25
A simple moving average of one period will yield identical results to a naive forecast.
Unlock Deck
Unlock for access to all 183 flashcards in this deck.
Unlock Deck
k this deck
26
Which one of the following basic patterns of demand is difficult to predict because it is affected by national or international events or because of a lack of demand history reflecting the stages of demand from product development to decline?
A)horizontal
B)seasonal
C)random
D)cyclical
A)horizontal
B)seasonal
C)random
D)cyclical
Unlock Deck
Unlock for access to all 183 flashcards in this deck.
Unlock Deck
k this deck
27
Polly Prognosticator was the greatest quantitative forecaster in recorded history.A skillful user of all techniques in your chapter on forecasting,she knew better than to try and develop a forecast for data that exhibited a:
A)random pattern.
B)horizontal pattern.
C)seasonal pattern.
D)cyclical pattern.
A)random pattern.
B)horizontal pattern.
C)seasonal pattern.
D)cyclical pattern.
Unlock Deck
Unlock for access to all 183 flashcards in this deck.
Unlock Deck
k this deck
28
Professor Willis noted that the popularity of his office hours mysteriously rose in the middle and the end of each semester,falling off to virtually no visitors throughout the rest of the year.The demand pattern at work is:
A)cyclical.
B)random.
C)seasonal.
D)trend.
A)cyclical.
B)random.
C)seasonal.
D)trend.
Unlock Deck
Unlock for access to all 183 flashcards in this deck.
Unlock Deck
k this deck
29
A bias error results from unpredictable factors that cause the forecast to deviate from actual demand.
Unlock Deck
Unlock for access to all 183 flashcards in this deck.
Unlock Deck
k this deck
30
Focus forecasting selects the best forecast from a group of forecasts generated by individual techniques.
Unlock Deck
Unlock for access to all 183 flashcards in this deck.
Unlock Deck
k this deck
31
Bias is the worst kind of forecasting error.
Unlock Deck
Unlock for access to all 183 flashcards in this deck.
Unlock Deck
k this deck
32
The trend projection with regression model can forecast demand well into the future.
Unlock Deck
Unlock for access to all 183 flashcards in this deck.
Unlock Deck
k this deck
33
When a significant trend is present,exponential smoothing forecasts can be below or above the actual demand,and must therefore be modified.
Unlock Deck
Unlock for access to all 183 flashcards in this deck.
Unlock Deck
k this deck
34
Forecast error is found by subtracting the forecast from the actual demand for a given period.
Unlock Deck
Unlock for access to all 183 flashcards in this deck.
Unlock Deck
k this deck
35
Some analysts prefer to use a holdout set as the final test of a forecasting procedure.
Unlock Deck
Unlock for access to all 183 flashcards in this deck.
Unlock Deck
k this deck
36
The trend projection with regression model is highly adaptive.
Unlock Deck
Unlock for access to all 183 flashcards in this deck.
Unlock Deck
k this deck
37
The electricity bill at Padco was driven solely by the lights throughout the office;everything else was driven by alternative energy sources.The office was open roughly 8 hours a day,five days a week and the cleaning crew spent about the same amount of time in the offices each week night.The kilowatt hour usage for the office was best described as a:
A)horizontal demand pattern.
B)random demand pattern.
C)seasonal demand pattern.
D)cyclical demand pattern.
A)horizontal demand pattern.
B)random demand pattern.
C)seasonal demand pattern.
D)cyclical demand pattern.
Unlock Deck
Unlock for access to all 183 flashcards in this deck.
Unlock Deck
k this deck
38
Better forecasting processes yield better forecasts.
Unlock Deck
Unlock for access to all 183 flashcards in this deck.
Unlock Deck
k this deck
39
An exponential smoothing model with an alpha equal to 1.00 is the same as a naive forecasting model.
Unlock Deck
Unlock for access to all 183 flashcards in this deck.
Unlock Deck
k this deck
40
Forecasts almost always contain errors.
Unlock Deck
Unlock for access to all 183 flashcards in this deck.
Unlock Deck
k this deck
41
Table 14.1
The Agricultural Extension Agent's Office has tracked fertilizer application and crop yields for a variety of chickpea and has recorded the data shown in the following table.Their staff statistician developed the regression model and computed the performance statistics displayed below the data.
Use the information provided in Table 14.1.The value of Fertilizer required to generate 100 bushels yield must be:
A)10.82.
B)12.25.
C)10.26.
D)9.07.
Unlock Deck
Unlock for access to all 183 flashcards in this deck.
Unlock Deck
k this deck
42
Table 14.2
A textbook publisher for books used in business schools believes that the number of books sold is related to the number of campus visits to decision makers made by their sales force.A sampling of the number of sales calls made and the number of books sold is shown in the following table.
Use the information provided in Table 14.2.What percent in the variation of the variable Books Sold is explained by the value of the variable Sales Calls Made?
A)86.5%
B)83.3%
C)74.8%
D)72.5%
Unlock Deck
Unlock for access to all 183 flashcards in this deck.
Unlock Deck
k this deck
43
Using salesforce estimates for forecasting has the advantage that:
A)no biases exist in the forecasts.
B)statistical estimates of seasonal factors are more precise than any other approach.
C)forecasts of individual sales force members can be easily combined to get regional or national sales totals.
D)confusion between customer "wants" (wish list)and customer "needs" (necessary purchases)is eliminated.
Unlock Deck
Unlock for access to all 183 flashcards in this deck.
Unlock Deck
k this deck
44
One aspect of demand that makes every forecast inaccurate is:
A)trend variation.
B)random variation.
C)cyclical variation.
D)seasonal variation.
A)trend variation.
B)random variation.
C)cyclical variation.
D)seasonal variation.
Unlock Deck
Unlock for access to all 183 flashcards in this deck.
Unlock Deck
k this deck
45
Table 14.1
The Agricultural Extension Agent's Office has tracked fertilizer application and crop yields for a variety of chickpea and has recorded the data shown in the following table.Their staff statistician developed the regression model and computed the performance statistics displayed below the data.
Use the information provided in Table 14.1.The value of Bushels when Fertilizer is 60 is:
A)2520.
B)490.
C)390.
D)518.
Unlock Deck
Unlock for access to all 183 flashcards in this deck.
Unlock Deck
k this deck
46
The Delphi method of forecasting is useful when:
A)judgment and opinion are the only bases for making informed projections
B)a systematic approach to creating and testing hypotheses is needed and the data are usually gathered by sending a questionnaire to consumers
C)historical data are available and the relationship between the factor to be forecast and other external or internal factors can be identified
D)historical data is available and the best basis for making projections is to use past demand patterns
Unlock Deck
Unlock for access to all 183 flashcards in this deck.
Unlock Deck
k this deck
47
The judgment methods of forecasting are to be used for purposes of:
A)making adjustments to quantitative forecasts due to unusual circumstances
B)forecasting seasonal demands in lieu of time-series approaches
C)avoiding the calculations necessary for quantitative forecasts
D)making forecasts more variable
A)making adjustments to quantitative forecasts due to unusual circumstances
B)forecasting seasonal demands in lieu of time-series approaches
C)avoiding the calculations necessary for quantitative forecasts
D)making forecasts more variable
Unlock Deck
Unlock for access to all 183 flashcards in this deck.
Unlock Deck
k this deck
48
Which one of the following statements about forecasting is TRUE?
A)The five basic patterns of demand are the horizontal,trend,seasonal,cyclical,and the subjective judgment of forecasters.
B)Judgment methods are particularly appropriate for situations in which historical data are lacking.
C)Casual methods are used when historical data are available and the relationship between the factor to be forecast and other external and internal factors cannot be identified.
D)Focused forecasting is a technique that focuses on one particular component of demand and develops a forecast from it.
Unlock Deck
Unlock for access to all 183 flashcards in this deck.
Unlock Deck
k this deck
49
The number of #2 pencils the bookstore sells appears to be highly correlated with the number of student credit hours each semester.The bookstore manager wants to create a linear regression model to assist her in placing an appropriate order.In this scenario:
A)the dependent variable is student credit hours
B)there are two independent variables
C)there are two dependent variables
D)the independent variable is student credit hours
A)the dependent variable is student credit hours
B)there are two independent variables
C)there are two dependent variables
D)the independent variable is student credit hours
Unlock Deck
Unlock for access to all 183 flashcards in this deck.
Unlock Deck
k this deck
50
Which one of the following statements about forecasting is FALSE?
A)Causal methods of forecasting use historical data on independent variables (promotional campaigns,competitors' actions,etc. )to predict demand.
B)Three general types of forecasting techniques are used for demand forecasting: time-series analysis,causal methods,and judgment methods.
C)Time series express the relationship between the factor to be forecast and related factors such as promotional campaigns,economic conditions,and competitor actions.
D)A time series is a list of repeated observations of a phenomenon,such as demand,arranged in the order in which they actually occurred.
Unlock Deck
Unlock for access to all 183 flashcards in this deck.
Unlock Deck
k this deck
51
The manufacturer developed and tested a questionnaire,designed to assist them in gauging the level of acceptance for their new product,and identified a representative sample as part of their:
A)salesforce estimate.
B)market research.
C)executive opinion.
D)Delphi method.
A)salesforce estimate.
B)market research.
C)executive opinion.
D)Delphi method.
Unlock Deck
Unlock for access to all 183 flashcards in this deck.
Unlock Deck
k this deck
52
Table 14.2
A textbook publisher for books used in business schools believes that the number of books sold is related to the number of campus visits to decision makers made by their sales force.A sampling of the number of sales calls made and the number of books sold is shown in the following table.
Use the information provided in Table 14.2.For every sale call made,the number of books sold increases by:
A)14.74 books.
B)104.6 books.
C)83.30 books.
D)7.25 books.
Unlock Deck
Unlock for access to all 183 flashcards in this deck.
Unlock Deck
k this deck
53
Table 14.1
The Agricultural Extension Agent's Office has tracked fertilizer application and crop yields for a variety of chickpea and has recorded the data shown in the following table.Their staff statistician developed the regression model and computed the performance statistics displayed below the data.
Use the information provided in Table 14.1.For every unit of fertilizer applied,the crop yield increases by:
A)8.0 bushels.
B)8.5 bushels.
C)8.9 bushels.
D)7.9 bushels.
Unlock Deck
Unlock for access to all 183 flashcards in this deck.
Unlock Deck
k this deck
54
Table 14.1
The Agricultural Extension Agent's Office has tracked fertilizer application and crop yields for a variety of chickpea and has recorded the data shown in the following table.Their staff statistician developed the regression model and computed the performance statistics displayed below the data.
Use the information provided in Table 14.1.What percent in the variation of the variable Bushels is explained by the value of the variable Fertilizer?
A)89%
B)79%
C)71%
D)50%
Unlock Deck
Unlock for access to all 183 flashcards in this deck.
Unlock Deck
k this deck
55
A linear regression model is developed that has a slope of -2.5 and an intercept of 10.The sample coefficient of determination is 0.50.Which of the following statements is TRUE?
A)The sample correlation coefficient must be 0.250.
B)The sample correlation coefficient must be -0.707.
C)The sample correlation coefficient must be -0.250.
D)The sample correlation coefficient must be 1.00.
A)The sample correlation coefficient must be 0.250.
B)The sample correlation coefficient must be -0.707.
C)The sample correlation coefficient must be -0.250.
D)The sample correlation coefficient must be 1.00.
Unlock Deck
Unlock for access to all 183 flashcards in this deck.
Unlock Deck
k this deck
56
When forecasting total demand for all their services or products,few companies err by more than:
A)one to four percent.
B)five to eight percent.
C)nine to twelve percent.
D)thirteen to sixteen percent.
A)one to four percent.
B)five to eight percent.
C)nine to twelve percent.
D)thirteen to sixteen percent.
Unlock Deck
Unlock for access to all 183 flashcards in this deck.
Unlock Deck
k this deck
57
Table 14.1
The Agricultural Extension Agent's Office has tracked fertilizer application and crop yields for a variety of chickpea and has recorded the data shown in the following table.Their staff statistician developed the regression model and computed the performance statistics displayed below the data.
Use the information in Table 14.1.If the correlation coefficient were negative,what would also be true?
A)The coefficient of determination would also be negative.
B)An increase in fertilizer would result in a decrease in crop yield.
C)Applying no fertilizer would mean a negative crop yield.
D)The standard error would also be negative.
Unlock Deck
Unlock for access to all 183 flashcards in this deck.
Unlock Deck
k this deck
58
A forecasting system that brings the manufacturer and its customers together to provide input for forecasting is a(n):
A)nested system.
B)harmonically balanced supply chain.
C)iterative Delphi method system for the supply chain.
D)collaborative planning,forecasting,and replenishment system.
A)nested system.
B)harmonically balanced supply chain.
C)iterative Delphi method system for the supply chain.
D)collaborative planning,forecasting,and replenishment system.
Unlock Deck
Unlock for access to all 183 flashcards in this deck.
Unlock Deck
k this deck
59
Which one of the following statements about the patterns of a demand series is FALSE?
A)The five basic patterns of most business demand series are the horizontal,trend,seasonal,cyclical,and random patterns.
B)Estimating cyclical movement is difficult.Forecasters do not know the duration of the cycle because they cannot predict the events that cause it.
C)The trend,over an extended period of time,always increases the average level of the series.
D)Every demand series has at least two components: horizontal and random.
Unlock Deck
Unlock for access to all 183 flashcards in this deck.
Unlock Deck
k this deck
60
It would be most appropriate to combine a judgment approach to forecasting with a quantitative approach by:
A)having a group of experts examine each historical data point to determine whether it should be included in the model.
B)combining opinions about the quantitative models to form one forecasting approach.
C)adjusting a forecast up or down to compensate for specific events not included in the quantitative technique.
D)developing a trend model to predict the outcomes of judgmental techniques in order to avoid the cost of employing the experts.
Unlock Deck
Unlock for access to all 183 flashcards in this deck.
Unlock Deck
k this deck
61
Table 14.4
The Furniture Super Mart is a furniture retailer in Evansville,Indiana.The Marketing Manager wants to prepare a media budget based on the next quarter's business plan.The manager wants to decide the mix of radio advertising and newspaper advertising needed to generate varying levels of Weekly Gross Revenue.The manager has collected data for the past five weeks,and has recorded the following average Weekly Gross Revenues and expenditures for Weekly Radio (X1)and Newspaper (X2)advertising:
The Manager uses the multiple regression model in OM Explorer and obtains the following results:
Use the information provided in Table 14.4.What is the estimated Weekly Gross Revenue if $7,000 is spent on Radio Advertising (X1)and $4,000 is spent on Newspaper Advertising (X2)?
A)$45,500
B)$15,000
C)$60,500
D)$81,000
The Furniture Super Mart is a furniture retailer in Evansville,Indiana.The Marketing Manager wants to prepare a media budget based on the next quarter's business plan.The manager wants to decide the mix of radio advertising and newspaper advertising needed to generate varying levels of Weekly Gross Revenue.The manager has collected data for the past five weeks,and has recorded the following average Weekly Gross Revenues and expenditures for Weekly Radio (X1)and Newspaper (X2)advertising:
The Manager uses the multiple regression model in OM Explorer and obtains the following results: Use the information provided in Table 14.4.What is the estimated Weekly Gross Revenue if $7,000 is spent on Radio Advertising (X1)and $4,000 is spent on Newspaper Advertising (X2)?
A)$45,500
B)$15,000
C)$60,500
D)$81,000
Unlock Deck
Unlock for access to all 183 flashcards in this deck.
Unlock Deck
k this deck
62
Which one of the following statements about forecasting is FALSE?
A)The method for incorporating a trend into an exponentially smoothed forecast requires the estimation of three smoothing constants: one for the mean,one for the trend,and one for the error.
B)The cumulative sum of forecast errors (CFE)is useful in measuring the bias in a forecast.
C)The standard deviation and the mean absolute deviation measure the dispersion of forecast errors.
D)A tracking signal is a measure that indicates whether a method of forecasting has any built-in biases over a period of time.
Unlock Deck
Unlock for access to all 183 flashcards in this deck.
Unlock Deck
k this deck
63
Table 14.2
A textbook publisher for books used in business schools believes that the number of books sold is related to the number of campus visits to decision makers made by their sales force.A sampling of the number of sales calls made and the number of books sold is shown in the following table.
Use the information provided in Table 14.2.If a sales representative makes 55 sales calls,the number of book sales the publisher should expect is:
A)105.
B)4,581.
C)114.
D)915.
Unlock Deck
Unlock for access to all 183 flashcards in this deck.
Unlock Deck
k this deck
64
Table 14.3
Columbia Appliance sells and delivers appliances in the Columbia,South Carolina area.The Operations and Supply Chain Manager wants to be able to predict the delivery crew's hours for easier scheduling.The delivery crew,consisting of a truck and two workers,must load the truck each day and then drive the truck to various locations to deliver appliances.Variables each day include miles driven and the number of deliveries made.The manager has collected data for the past five weeks,and has recorded the following average daily crew hours worked,miles driven and deliveries made:
The manager uses the multiple regression model in POM for Windows and obtains the following results:
Use the information provided in Table 14.3.If 10 extra miles of driving is added to the crew's daily work,how much time is added to their work schedule for that day? (Assume all other variables are held constant. )
A)30 minutes
B)2.4 minutes
C)24 minutes
D)48 minutes
Columbia Appliance sells and delivers appliances in the Columbia,South Carolina area.The Operations and Supply Chain Manager wants to be able to predict the delivery crew's hours for easier scheduling.The delivery crew,consisting of a truck and two workers,must load the truck each day and then drive the truck to various locations to deliver appliances.Variables each day include miles driven and the number of deliveries made.The manager has collected data for the past five weeks,and has recorded the following average daily crew hours worked,miles driven and deliveries made:
The manager uses the multiple regression model in POM for Windows and obtains the following results: Use the information provided in Table 14.3.If 10 extra miles of driving is added to the crew's daily work,how much time is added to their work schedule for that day? (Assume all other variables are held constant. )
A)30 minutes
B)2.4 minutes
C)24 minutes
D)48 minutes
Unlock Deck
Unlock for access to all 183 flashcards in this deck.
Unlock Deck
k this deck
65
Table 14.2
A textbook publisher for books used in business schools believes that the number of books sold is related to the number of campus visits to decision makers made by their sales force.A sampling of the number of sales calls made and the number of books sold is shown in the following table.
Use the information provided in Table 14.2.In order to realize the sale of 700 books,how many sales calls will the sales representative have to make?
A)40.4
B)45.9
C)32.7
D)37.6
Unlock Deck
Unlock for access to all 183 flashcards in this deck.
Unlock Deck
k this deck
66
Which of the following statements regarding time-series methods is FALSE?
A)A naive forecast is identical to a simple moving average of one period.
B)Exponential smoothing with an alpha equal to 1.00 is identical to a naive forecast.
C)A weighted moving average with weights of 0.5 and 0.5 is identical to a simple moving average of two periods.
D)A simple moving average of three periods is identical to exponential smoothing with an alpha equal to 0.33.
Unlock Deck
Unlock for access to all 183 flashcards in this deck.
Unlock Deck
k this deck
67
Table 14.4
The Furniture Super Mart is a furniture retailer in Evansville,Indiana.The Marketing Manager wants to prepare a media budget based on the next quarter's business plan.The manager wants to decide the mix of radio advertising and newspaper advertising needed to generate varying levels of Weekly Gross Revenue.The manager has collected data for the past five weeks,and has recorded the following average Weekly Gross Revenues and expenditures for Weekly Radio (X1)and Newspaper (X2)advertising:
The Manager uses the multiple regression model in OM Explorer and obtains the following results:
Use the information provided in Table 14.4.Adding $1,000 of Weekly Radio Advertising (X1)can be expected to increase Weekly Gross Revenues by what amount? (Assume all other variables are held constant. )
A)$20,500
B)$3,750
C)$6,500
D)$10,250
The Furniture Super Mart is a furniture retailer in Evansville,Indiana.The Marketing Manager wants to prepare a media budget based on the next quarter's business plan.The manager wants to decide the mix of radio advertising and newspaper advertising needed to generate varying levels of Weekly Gross Revenue.The manager has collected data for the past five weeks,and has recorded the following average Weekly Gross Revenues and expenditures for Weekly Radio (X1)and Newspaper (X2)advertising:
The Manager uses the multiple regression model in OM Explorer and obtains the following results: Use the information provided in Table 14.4.Adding $1,000 of Weekly Radio Advertising (X1)can be expected to increase Weekly Gross Revenues by what amount? (Assume all other variables are held constant. )
A)$20,500
B)$3,750
C)$6,500
D)$10,250
Unlock Deck
Unlock for access to all 183 flashcards in this deck.
Unlock Deck
k this deck
68
Table 14.4
The Furniture Super Mart is a furniture retailer in Evansville,Indiana.The Marketing Manager wants to prepare a media budget based on the next quarter's business plan.The manager wants to decide the mix of radio advertising and newspaper advertising needed to generate varying levels of Weekly Gross Revenue.The manager has collected data for the past five weeks,and has recorded the following average Weekly Gross Revenues and expenditures for Weekly Radio (X1)and Newspaper (X2)advertising:
The Manager uses the multiple regression model in OM Explorer and obtains the following results:
Use the information provided in Table 14.4.Adding $1,000 of Weekly Newspaper Advertising (X2)can be expected to increase Weekly Gross Revenues by what amount? (Assume all other variables are held constant. )
A)$20,500
B)$3,750
C)$6,500
D)$10,250
The Furniture Super Mart is a furniture retailer in Evansville,Indiana.The Marketing Manager wants to prepare a media budget based on the next quarter's business plan.The manager wants to decide the mix of radio advertising and newspaper advertising needed to generate varying levels of Weekly Gross Revenue.The manager has collected data for the past five weeks,and has recorded the following average Weekly Gross Revenues and expenditures for Weekly Radio (X1)and Newspaper (X2)advertising:
The Manager uses the multiple regression model in OM Explorer and obtains the following results: Use the information provided in Table 14.4.Adding $1,000 of Weekly Newspaper Advertising (X2)can be expected to increase Weekly Gross Revenues by what amount? (Assume all other variables are held constant. )
A)$20,500
B)$3,750
C)$6,500
D)$10,250
Unlock Deck
Unlock for access to all 183 flashcards in this deck.
Unlock Deck
k this deck
69
Table 14.4
The Furniture Super Mart is a furniture retailer in Evansville,Indiana.The Marketing Manager wants to prepare a media budget based on the next quarter's business plan.The manager wants to decide the mix of radio advertising and newspaper advertising needed to generate varying levels of Weekly Gross Revenue.The manager has collected data for the past five weeks,and has recorded the following average Weekly Gross Revenues and expenditures for Weekly Radio (X1)and Newspaper (X2)advertising:
The Manager uses the multiple regression model in OM Explorer and obtains the following results:
Use the information provided in Table 14.4.What is the estimated Weekly Gross Revenue if $4,000 is spent on Radio Advertising (X1)and $7,000 is spent on Newspaper Advertising (X2)?
A)$52,250
B)$26,250
C)$72,750
D)$20,500
The Furniture Super Mart is a furniture retailer in Evansville,Indiana.The Marketing Manager wants to prepare a media budget based on the next quarter's business plan.The manager wants to decide the mix of radio advertising and newspaper advertising needed to generate varying levels of Weekly Gross Revenue.The manager has collected data for the past five weeks,and has recorded the following average Weekly Gross Revenues and expenditures for Weekly Radio (X1)and Newspaper (X2)advertising:
The Manager uses the multiple regression model in OM Explorer and obtains the following results: Use the information provided in Table 14.4.What is the estimated Weekly Gross Revenue if $4,000 is spent on Radio Advertising (X1)and $7,000 is spent on Newspaper Advertising (X2)?
A)$52,250
B)$26,250
C)$72,750
D)$20,500
Unlock Deck
Unlock for access to all 183 flashcards in this deck.
Unlock Deck
k this deck
70
Which one of the following is most useful for measuring the bias in a forecast?
A)cumulative sum of forecast errors
B)standard deviation of forecast errors
C)mean absolute deviation of forecast errors
D)percentage forecast error in period t
A)cumulative sum of forecast errors
B)standard deviation of forecast errors
C)mean absolute deviation of forecast errors
D)percentage forecast error in period t
Unlock Deck
Unlock for access to all 183 flashcards in this deck.
Unlock Deck
k this deck
71
When the underlying mean of a time series is very stable and there are no trend,cyclical,or seasonal influences:
A)a simple moving-average forecast with n = 20 should outperform a simple moving-average forecast with n = 3.
B)a simple moving-average forecast with n = 3 should outperform a simple moving-average forecast with n = 15.
C)a simple moving-average forecast with n = 20 should perform about the same as a simple moving-average forecast with n = 3.
D)an exponential smoothing forecast with a = 0.30 should outperform a simple moving-average forecast with α = 0.01.
Unlock Deck
Unlock for access to all 183 flashcards in this deck.
Unlock Deck
k this deck
72
Assume that a time-series forecast is generated for future demand and subsequently it is observed that the forecast method did not accurately predict the actual demand.Specifically,the forecast errors were found to be: Mean absolute percent error = 10%
Cumulative sum of forecast errors = 0
Which one of the statements concerning this forecast is TRUE?
A)The forecast has no bias but has a positive standard deviation of errors.
B)The forecast has a positive bias and a standard deviation of errors equal to zero.
C)The forecast has no bias and has a standard deviation of errors equal to zero.
D)The forecast has a positive bias and a positive standard deviation of errors.
Unlock Deck
Unlock for access to all 183 flashcards in this deck.
Unlock Deck
k this deck
73
With the multiplicative seasonal method of forecasting:
A)the times series cannot exhibit a trend.
B)seasonal factors are multiplied by an estimate of average demand to arrive at a seasonal forecast.
C)the seasonal amplitude is a constant,regardless of the magnitude of average demand.
D)there can be only four seasons in the time-series data.
A)the times series cannot exhibit a trend.
B)seasonal factors are multiplied by an estimate of average demand to arrive at a seasonal forecast.
C)the seasonal amplitude is a constant,regardless of the magnitude of average demand.
D)there can be only four seasons in the time-series data.
Unlock Deck
Unlock for access to all 183 flashcards in this deck.
Unlock Deck
k this deck
74
Table 14.3
Columbia Appliance sells and delivers appliances in the Columbia,South Carolina area.The Operations and Supply Chain Manager wants to be able to predict the delivery crew's hours for easier scheduling.The delivery crew,consisting of a truck and two workers,must load the truck each day and then drive the truck to various locations to deliver appliances.Variables each day include miles driven and the number of deliveries made.The manager has collected data for the past five weeks,and has recorded the following average daily crew hours worked,miles driven and deliveries made:
The manager uses the multiple regression model in POM for Windows and obtains the following results:
Use the information provided in Table 14.3.If one delivery is added to the crew's daily work,how much time is added to their work schedule for that day? (Assume all other variables are held constant. )
A)30 minutes
B)2.4 minutes
C)24 minutes
D)48 minutes
Columbia Appliance sells and delivers appliances in the Columbia,South Carolina area.The Operations and Supply Chain Manager wants to be able to predict the delivery crew's hours for easier scheduling.The delivery crew,consisting of a truck and two workers,must load the truck each day and then drive the truck to various locations to deliver appliances.Variables each day include miles driven and the number of deliveries made.The manager has collected data for the past five weeks,and has recorded the following average daily crew hours worked,miles driven and deliveries made:
The manager uses the multiple regression model in POM for Windows and obtains the following results: Use the information provided in Table 14.3.If one delivery is added to the crew's daily work,how much time is added to their work schedule for that day? (Assume all other variables are held constant. )
A)30 minutes
B)2.4 minutes
C)24 minutes
D)48 minutes
Unlock Deck
Unlock for access to all 183 flashcards in this deck.
Unlock Deck
k this deck
75
Which one of the following statements is TRUE?
A)The ideal of zero bias and zero MAD can be accomplished by systematically searching for the best values of the smoothing constants.
B)Bias is always less than MAD.
C)For projections of more stable demand patterns without trends,seasonal influences,or cyclical influences,use larger values of n in the simple moving-average approach.
D)One disadvantage of a weighted moving average forecast is that it does not allow you to emphasize recent demand over earlier demand.
Unlock Deck
Unlock for access to all 183 flashcards in this deck.
Unlock Deck
k this deck
76
A tracking signal greater than zero and a mean absolute deviation greater than zero imply that the forecast has:
A)no bias and no variability of forecast error.
B)a nonzero amount of bias and a nonzero amount of forecast error variability.
C)no bias and a nonzero amount of forecast error variability.
D)a nonzero amount of bias and no variability of forecast error.
A)no bias and no variability of forecast error.
B)a nonzero amount of bias and a nonzero amount of forecast error variability.
C)no bias and a nonzero amount of forecast error variability.
D)a nonzero amount of bias and no variability of forecast error.
Unlock Deck
Unlock for access to all 183 flashcards in this deck.
Unlock Deck
k this deck
77
Table 14.4
The Furniture Super Mart is a furniture retailer in Evansville,Indiana.The Marketing Manager wants to prepare a media budget based on the next quarter's business plan.The manager wants to decide the mix of radio advertising and newspaper advertising needed to generate varying levels of Weekly Gross Revenue.The manager has collected data for the past five weeks,and has recorded the following average Weekly Gross Revenues and expenditures for Weekly Radio (X1)and Newspaper (X2)advertising:
The Manager uses the multiple regression model in OM Explorer and obtains the following results:
Use the information provided in Table 14.4.What amount of Weekly Gross Revenue can be expected for a week in which no radio or newspaper advertising is purchased? (Assume all other variables are held constant. )
A)$20,500
B)$3,750
C)$6,500
D)$10,250
The Furniture Super Mart is a furniture retailer in Evansville,Indiana.The Marketing Manager wants to prepare a media budget based on the next quarter's business plan.The manager wants to decide the mix of radio advertising and newspaper advertising needed to generate varying levels of Weekly Gross Revenue.The manager has collected data for the past five weeks,and has recorded the following average Weekly Gross Revenues and expenditures for Weekly Radio (X1)and Newspaper (X2)advertising:
The Manager uses the multiple regression model in OM Explorer and obtains the following results: Use the information provided in Table 14.4.What amount of Weekly Gross Revenue can be expected for a week in which no radio or newspaper advertising is purchased? (Assume all other variables are held constant. )
A)$20,500
B)$3,750
C)$6,500
D)$10,250
Unlock Deck
Unlock for access to all 183 flashcards in this deck.
Unlock Deck
k this deck
78
Table 14.3
Columbia Appliance sells and delivers appliances in the Columbia,South Carolina area.The Operations and Supply Chain Manager wants to be able to predict the delivery crew's hours for easier scheduling.The delivery crew,consisting of a truck and two workers,must load the truck each day and then drive the truck to various locations to deliver appliances.Variables each day include miles driven and the number of deliveries made.The manager has collected data for the past five weeks,and has recorded the following average daily crew hours worked,miles driven and deliveries made:
The manager uses the multiple regression model in POM for Windows and obtains the following results:
Use the information provided in Table 14.3.What is the estimated work time for the crew if the schedule that day calls for 85 driving miles and 6 deliveries?
A)8.1 hours
B)9.2 hours
C)8.9 hours
D)9.5 hours
Columbia Appliance sells and delivers appliances in the Columbia,South Carolina area.The Operations and Supply Chain Manager wants to be able to predict the delivery crew's hours for easier scheduling.The delivery crew,consisting of a truck and two workers,must load the truck each day and then drive the truck to various locations to deliver appliances.Variables each day include miles driven and the number of deliveries made.The manager has collected data for the past five weeks,and has recorded the following average daily crew hours worked,miles driven and deliveries made:
The manager uses the multiple regression model in POM for Windows and obtains the following results: Use the information provided in Table 14.3.What is the estimated work time for the crew if the schedule that day calls for 85 driving miles and 6 deliveries?
A)8.1 hours
B)9.2 hours
C)8.9 hours
D)9.5 hours
Unlock Deck
Unlock for access to all 183 flashcards in this deck.
Unlock Deck
k this deck
79
Which one of the following statements about forecasting is FALSE?
A)You should use the simple moving-average method to estimate the mean demand of a time series that has a pronounced trend and seasonal influences.
B)The weighted moving-average method allows forecasters to emphasize recent demand over earlier demand.The forecast will be more responsive to change in the underlying average of the demand series.
C)The most frequently used time-series forecasting method is exponential smoothing because of its simplicity and the small amount of data needed to support it.
D)In exponential smoothing,higher values of alpha place greater weight on recent demands in computing the average.
Unlock Deck
Unlock for access to all 183 flashcards in this deck.
Unlock Deck
k this deck
80
Table 14.3
Columbia Appliance sells and delivers appliances in the Columbia,South Carolina area.The Operations and Supply Chain Manager wants to be able to predict the delivery crew's hours for easier scheduling.The delivery crew,consisting of a truck and two workers,must load the truck each day and then drive the truck to various locations to deliver appliances.Variables each day include miles driven and the number of deliveries made.The manager has collected data for the past five weeks,and has recorded the following average daily crew hours worked,miles driven and deliveries made:
The manager uses the multiple regression model in POM for Windows and obtains the following results:
Use the information provided in Table 14.3.What is the estimated work time for the crew if the schedule that day calls for 90 driving miles and 4 deliveries?
A)8.1 hours
B)9.2 hours
C)8.9 hours
D)8.5 hours
Columbia Appliance sells and delivers appliances in the Columbia,South Carolina area.The Operations and Supply Chain Manager wants to be able to predict the delivery crew's hours for easier scheduling.The delivery crew,consisting of a truck and two workers,must load the truck each day and then drive the truck to various locations to deliver appliances.Variables each day include miles driven and the number of deliveries made.The manager has collected data for the past five weeks,and has recorded the following average daily crew hours worked,miles driven and deliveries made:
The manager uses the multiple regression model in POM for Windows and obtains the following results: Use the information provided in Table 14.3.What is the estimated work time for the crew if the schedule that day calls for 90 driving miles and 4 deliveries?
A)8.1 hours
B)9.2 hours
C)8.9 hours
D)8.5 hours
Unlock Deck
Unlock for access to all 183 flashcards in this deck.
Unlock Deck
k this deck
Unlock Deck
Unlock for access to all 183 flashcards in this deck.


