Exam 14: Forecasting
Exam 1: Using Operations to Compete107 Questions
Exam 2: Project Management151 Questions
Exam 3: Process Strategy149 Questions
Exam 4: Process Analysis192 Questions
Exam 5: Quality and Performance223 Questions
Exam 6: Capacity Planning133 Questions
Exam 7: Constraint Management160 Questions
Exam 8: Lean Systems179 Questions
Exam 9: Supply Chain Inventory Management216 Questions
Exam 10: Supply Chain Design93 Questions
Exam 11: Supply Chain Location Decisions126 Questions
Exam 12: Supply Chain Integration130 Questions
Exam 13: Supply Chain Sustainability and Humanitarian Logistics77 Questions
Exam 14: Forecasting183 Questions
Exam 15: Operations Planning and Scheduling191 Questions
Exam 16: Resource Planning149 Questions
Exam 17: Decision Making118 Questions
Exam 18: Waiting Line127 Questions
Exam 19: Special Inventory Models53 Questions
Exam 20: Linear Programming84 Questions
Exam 21: Simulation61 Questions
Exam 22: Financial Analysis60 Questions
Exam 23: Acceptance Sampling Plans88 Questions
Exam 24: Measuring Output Rates103 Questions
Exam 25: Learning Curve Analysis56 Questions
Exam 26: Operations Scheduling131 Questions
Select questions type
Use the data and graph shown below for the following questions. 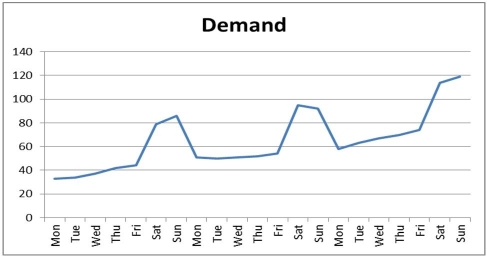
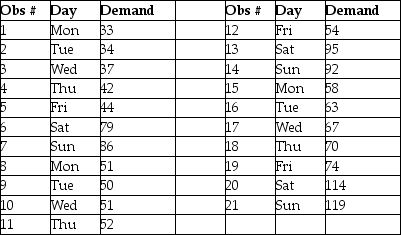 -Refer to the instruction above.Use a trend projection to forecast the next week's demand.Then apply seasonal indices to determine the demand on Saturday of the fourth week.What is the demand projected to be?
Free
(Multiple Choice)
4.8/5  (38)
(38)
Correct Answer: Verified
A
Assume that a time-series forecast is generated for future demand and subsequently it is observed that the forecast method did not accurately predict the actual demand.Specifically,the forecast errors were found to be: Mean absolute percent error = 10%
Cumulative sum of forecast errors = 0
Which one of the statements concerning this forecast is TRUE?
Free
(Multiple Choice)
4.8/5 (25)
Correct Answer:Verified
A
________ is a systematic approach to determine consumer interest in a product or service by creating and testing hypotheses through data-gathering surveys.
Free
(Essay)
4.7/5 (34)
Correct Answer:Verified
Market research
In an exponential smoothing model a ________ value for alpha results in greater emphasis being placed on more recent periods.
(Essay)
4.8/5 (32)
The Classical Consultant Company provides forecasting research for clients such as a group of five doctors associated with a new hospital health-maintenance program.The company has been asked to forecast the number of patients requesting blood analysis per week.The past weekly average is 38 and,for the trend,is 2 per week.This week's demand was 42 blood tests.How many patients will come next week? (Suppose = 0.10 and = 0.30. )
(Multiple Choice)
4.9/5 (33)
Judgment methods of forecasting are quantitative methods that use historical data on independent variables to predict demand.
(True/False)
4.8/5 (35)
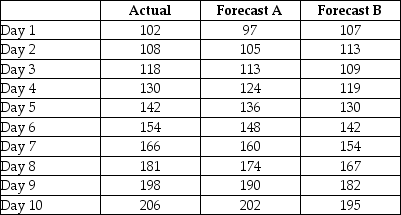
Two mercenary forecasters dueled for the lucrative Surreal Farms egg production forecasting job.The farmer provided them with output levels from ten day's production and had them forecast the next ten days.The combatant's forecasts and the actual egg production are shown in the table.Which forecaster was more accurate and should be hired as a result of his performance on this trial?
(Essay)
4.7/5 (35)
Which one of the following basic patterns of demand is difficult to predict because it is affected by national or international events or because of a lack of demand history reflecting the stages of demand from product development to decline?
(Multiple Choice)
4.7/5 (32)
Some analysts prefer to use a holdout set as the final test of a forecasting procedure.
(True/False)
4.8/5 (34)
Which one of the following statements about the patterns of a demand series is FALSE?
(Multiple Choice)
4.9/5 (33)
Table 14.8 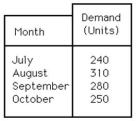 -Use the information in Table 14.8.Using the 4-month weighted moving-average technique and the following weights,what is the forecasted demand for November?
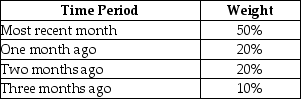
(Multiple Choice)
4.9/5 (36)
Table 14.8
-Use the information in Table 14.8.Using the simple moving-average technique for the most recent three months,what will be the forecasted demand for November?
(Multiple Choice)
4.8/5 (28)
Table 14.10
TOMBOW is a small manufacturer of pencils and has had the following sales record for the most recent five months: 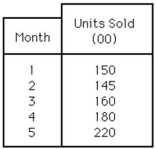 Use an exponential smoothing model to forecast sales in months 2,3,4,and 5.Let the smoothing parameter equal 0.6;select F1 = 150 to get the forecast started.
-Use the information in Table 14.10.The forecast for month 4 is:
Use an exponential smoothing model to forecast sales in months 2,3,4,and 5.Let the smoothing parameter equal 0.6;select F1 = 150 to get the forecast started.
-Use the information in Table 14.10.The forecast for month 4 is:
(Multiple Choice)
4.8/5 (34)
Table 14.13
The manager of a pizza shop must forecast weekly demand for special pizzas so that he can order pizza shells weekly.Recent demand has been:
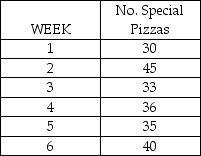 -Use the information from Table 14.13.The pizza shop manager is looking for a forecasting approach that will forecast her demand within 0.5 pizzas.If the actual demand for week #7 was 39 pizzas,which of the combination forecasts came closest to predicting this demand?
(Multiple Choice)
4.8/5 (37)
________ methods use historical data on independent variables to predict demand.
(Essay)
4.8/5 (39)
The Delphi method is a process of gaining consensus from a group of experts by debate and voting throughout several rounds of group discussion led by a moderator.
(True/False)
4.8/5 (32)
________ are produced by averaging independent forecasts based on different methods or different data,or both.
(Essay)
4.8/5 (36)
Table 14.5
The manager of a pizza shop must forecast weekly demand for special pizzas so that he can order pizza shells weekly.Recent demand has been: 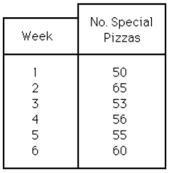 -Use the information from Table 14.5.If a naive forecast were constructed,the forecast for week 7 would be:
(Multiple Choice)
4.9/5 (44)
Table 14.7 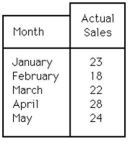 -Use the information in Table 14.7.Suppose actual sales in June turn out to be 40 units.Use the three-month moving-average method to forecast the sales in July.
(Multiple Choice)
4.8/5 (30)
Filters
- Essay(0)
- Multiple Choice(0)
- Short Answer(0)
- True False(0)
- Matching(0)