Deck 20: Simulation
Full screen (f)
Question
Question
Question
Question
Question
Question
Question
Question
Question
Question
Question
Question
Question
A manager has been given the table shown below and is asked to generate random numbers.Which of the following statements is TRUE? 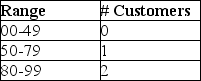
A)There are no customers in the store 49 percent of the time.
B)The probability of having one customer in the store is 0.30.
C)The relative frequency of having two customers in the store is 0.80.
D)If we randomly choose the numbers 0 through 99 enough times,about 99 percent of the time we will have two customers in the store.
Question
Question
Question
Question
Question
Question
Question
Question
Question
Question
This table shows the distribution of grades in an operations management class. 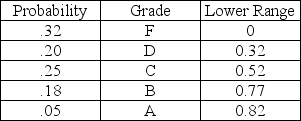 Add a column to the table that shows the cumulative probability and indicate what letter grade is obtained when the RAND()function is equal to 0.7406
A)A
B)B
C)C
D)D
Add a column to the table that shows the cumulative probability and indicate what letter grade is obtained when the RAND()function is equal to 0.7406A)A
B)B
C)C
D)D
Question
Question
This table shows the distribution of grades in an operations management class.  Add a column to the table that shows the cumulative probability and indicate what letter grade is obtained when the RAND()function is equal to 0.982245
A)A
B)B
C)C
D)D
Add a column to the table that shows the cumulative probability and indicate what letter grade is obtained when the RAND()function is equal to 0.982245A)A
B)B
C)C
D)D
Question
Question
Question
Question
Question
Question
This table shows the distribution of grades in an operations management class.  Add a column to the table that shows the cumulative probability and indicate what letter grade is obtained when the RAND()function is equal to 0.5548
A)A
B)B
C)C
D)D
Add a column to the table that shows the cumulative probability and indicate what letter grade is obtained when the RAND()function is equal to 0.5548A)A
B)B
C)C
D)D
Question
Question
Question
Question
Question
Question
Question
Question
Question
Question
Scenario E.1
SimQuick is being used to simulate the following bank process: Customer arrivals at the Entrance Door of the bank with an average time between arrivals of 2.5 minutes.The Line Buffer holds 6 customers.If a customer arrives and the buffer line is filled,the customer leaves.The Work Station Teller's processing time per customer is normally distributed,with a mean of 3.0 minutes and a standard deviation of 0.5 minutes.The Served Customer Buffer in the flow chart is used to count the number of customers processed during the period simulated.A 2-hour period was simulated.
The SimQuick simulation is run,and the results are as follows:
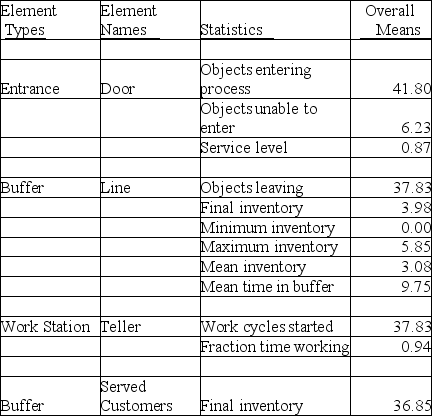
Use the information in Scenario E.1.On average,approximately how many customers were waiting in line during the 2-hour simulation period?
A)5
B)4
C)3
D)2
SimQuick is being used to simulate the following bank process:
Customer arrivals at the Entrance Door of the bank with an average time between arrivals of 2.5 minutes.The Line Buffer holds 6 customers.If a customer arrives and the buffer line is filled,the customer leaves.The Work Station Teller's processing time per customer is normally distributed,with a mean of 3.0 minutes and a standard deviation of 0.5 minutes.The Served Customer Buffer in the flow chart is used to count the number of customers processed during the period simulated.A 2-hour period was simulated.The SimQuick simulation is run,and the results are as follows:
Use the information in Scenario E.1.On average,approximately how many customers were waiting in line during the 2-hour simulation period?
A)5
B)4
C)3
D)2
Question
Scenario E.1
SimQuick is being used to simulate the following bank process: Customer arrivals at the Entrance Door of the bank with an average time between arrivals of 2.5 minutes.The Line Buffer holds 6 customers.If a customer arrives and the buffer line is filled,the customer leaves.The Work Station Teller's processing time per customer is normally distributed,with a mean of 3.0 minutes and a standard deviation of 0.5 minutes.The Served Customer Buffer in the flow chart is used to count the number of customers processed during the period simulated.A 2-hour period was simulated.
The SimQuick simulation is run,and the results are as follows:
Use the information in Scenario E.1.Approximately how much time did the average customer who entered the system spend waiting in line?
A)9)75 minutes
B)3)08 minutes
C)5)85 minutes
D)3)98 minutes
SimQuick is being used to simulate the following bank process:
Customer arrivals at the Entrance Door of the bank with an average time between arrivals of 2.5 minutes.The Line Buffer holds 6 customers.If a customer arrives and the buffer line is filled,the customer leaves.The Work Station Teller's processing time per customer is normally distributed,with a mean of 3.0 minutes and a standard deviation of 0.5 minutes.The Served Customer Buffer in the flow chart is used to count the number of customers processed during the period simulated.A 2-hour period was simulated.The SimQuick simulation is run,and the results are as follows:
Use the information in Scenario E.1.Approximately how much time did the average customer who entered the system spend waiting in line?
A)9)75 minutes
B)3)08 minutes
C)5)85 minutes
D)3)98 minutes
Question
Question
Question
Scenario E.1
SimQuick is being used to simulate the following bank process: Customer arrivals at the Entrance Door of the bank with an average time between arrivals of 2.5 minutes.The Line Buffer holds 6 customers.If a customer arrives and the buffer line is filled,the customer leaves.The Work Station Teller's processing time per customer is normally distributed,with a mean of 3.0 minutes and a standard deviation of 0.5 minutes.The Served Customer Buffer in the flow chart is used to count the number of customers processed during the period simulated.A 2-hour period was simulated.
The SimQuick simulation is run,and the results are as follows:
Use the information in Scenario E.1.Approximately how many total customers arrived during the 2-hour period simulated?
A)42
B)38
C)44
D)48
SimQuick is being used to simulate the following bank process:
Customer arrivals at the Entrance Door of the bank with an average time between arrivals of 2.5 minutes.The Line Buffer holds 6 customers.If a customer arrives and the buffer line is filled,the customer leaves.The Work Station Teller's processing time per customer is normally distributed,with a mean of 3.0 minutes and a standard deviation of 0.5 minutes.The Served Customer Buffer in the flow chart is used to count the number of customers processed during the period simulated.A 2-hour period was simulated.The SimQuick simulation is run,and the results are as follows:
Use the information in Scenario E.1.Approximately how many total customers arrived during the 2-hour period simulated?
A)42
B)38
C)44
D)48
Question
SimQuick is to be used to simulate the following bank process:  Customers arrive at the Entrance Door of the bank with an average time between arrivals of 2.5 minutes The Line Buffer holds 6 customers.If a customer arrives and the buffer line is filled,the customer leaves.The Work Station Teller's processing time per customer is normally distributed,with a mean of 3.0 minutes and a standard deviation of 0.5 minutes.The Served Customer Buffer in the flowchart is used to count the number of customers processed during the simulation period.A 2-hour period is to be simulated and the simulation should be repeated 30 times.Determine:
a)The number of customers served during the 2-hour period;
b)The percentage of customers who arrived at the bank and left because the buffer line was full;
c)The utilization of the teller (% of time working)during the 2-hour period;
Customers arrive at the Entrance Door of the bank with an average time between arrivals of 2.5 minutes The Line Buffer holds 6 customers.If a customer arrives and the buffer line is filled,the customer leaves.The Work Station Teller's processing time per customer is normally distributed,with a mean of 3.0 minutes and a standard deviation of 0.5 minutes.The Served Customer Buffer in the flowchart is used to count the number of customers processed during the simulation period.A 2-hour period is to be simulated and the simulation should be repeated 30 times.Determine:a)The number of customers served during the 2-hour period;
b)The percentage of customers who arrived at the bank and left because the buffer line was full;
c)The utilization of the teller (% of time working)during the 2-hour period;
Question
Question
Scenario E.1
SimQuick is being used to simulate the following bank process: Customer arrivals at the Entrance Door of the bank with an average time between arrivals of 2.5 minutes.The Line Buffer holds 6 customers.If a customer arrives and the buffer line is filled,the customer leaves.The Work Station Teller's processing time per customer is normally distributed,with a mean of 3.0 minutes and a standard deviation of 0.5 minutes.The Served Customer Buffer in the flow chart is used to count the number of customers processed during the period simulated.A 2-hour period was simulated.
The SimQuick simulation is run,and the results are as follows:
Use the information in Scenario E.1.Approximately what percentage of total customers who arrived during the 2-hour period found the buffer full and were not able to enter?
A)87%
B)13%
C)94%
D)6%
SimQuick is being used to simulate the following bank process:
Customer arrivals at the Entrance Door of the bank with an average time between arrivals of 2.5 minutes.The Line Buffer holds 6 customers.If a customer arrives and the buffer line is filled,the customer leaves.The Work Station Teller's processing time per customer is normally distributed,with a mean of 3.0 minutes and a standard deviation of 0.5 minutes.The Served Customer Buffer in the flow chart is used to count the number of customers processed during the period simulated.A 2-hour period was simulated.The SimQuick simulation is run,and the results are as follows:
Use the information in Scenario E.1.Approximately what percentage of total customers who arrived during the 2-hour period found the buffer full and were not able to enter?
A)87%
B)13%
C)94%
D)6%
Question
Question
Question
Question
Question
Big Bills McGee carries no paper money less than $10 in his wallet,preferring to have a ready supply of $10,$20,$50,and $100 denominations at all times.He is concerned about pickpockets and has an amusing anecdote about thwarting a pickpocket on the Athens subway he likes to tell.His business associate conducts a Monte Carlo simulation for Big Bills using POM for Windows software and prints out the results copied below.Using this output,provide your interpretation for Big Bills pickpocket scenario. 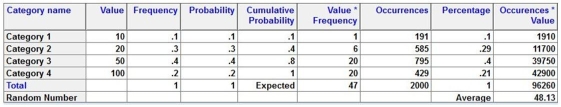
Question

Unlock Deck
Sign up to unlock the cards in this deck!
Unlock Deck
Unlock Deck
1/54
Play
Full screen (f)
Deck 20: Simulation
1
The manager of a branch bank wants to build a simulation model of the lobby operation to reduce the waiting time of her customers.The number of customers waiting in line at any point of time is an example of a(n):
A)decision variable.
B)dependent variable.
C)uncontrollable variable.
D)time-compressed variable.
A)decision variable.
B)dependent variable.
C)uncontrollable variable.
D)time-compressed variable.
B
2
Using a simulation model to gather a year of operating data in a few minutes is known as:
A)historical search data collection.
B)Monte Carlo optimization.
C)suboptimization.
D)time compression.
A)historical search data collection.
B)Monte Carlo optimization.
C)suboptimization.
D)time compression.
D
3
What are the differences between decision variables and uncontrolled variables? Describe the differences and provide an example from a simulation model.
A decision variable is one that is under control of the decision maker and will change from one simulation run to the next as different events are simulated.Uncontrolled variables are random events that the decision maker cannot control.Both are functions of random numbers in the simulation model,but the decision maker realizes that the uncontrolled variables,such as weather,customer arrival patterns,state of the economy,and so on are outside his influence.Examples will vary.
4
A simulation model:
A)describes operating characteristics with known equations.
B)replicates the service of customers and keeps track of characteristics such as the number in line,the waiting time,and the total time in the system.
C)prescribes what should be done in a situation.
D)finds the optimal solution to a problem without having to try each alternative.
Unlock Deck
Unlock for access to all 54 flashcards in this deck.
Unlock Deck
k this deck
5
________ is a feature of simulation models that allows them to obtain operating-characteristic estimates in much less time than is required to gather the same operating data from a real system.
Unlock Deck
Unlock for access to all 54 flashcards in this deck.
Unlock Deck
k this deck
6
Simulation models are:
A)useful when waiting line models are too complex.
B)useful for conducting experiments using the real system.
C)preferred because they find optimal solutions.
D)usually inexpensive relative to other approaches.
A)useful when waiting line models are too complex.
B)useful for conducting experiments using the real system.
C)preferred because they find optimal solutions.
D)usually inexpensive relative to other approaches.
Unlock Deck
Unlock for access to all 54 flashcards in this deck.
Unlock Deck
k this deck
7
Monte Carlo simulation is the use of computer graphics to show customers or products moving through a series of process steps.
Unlock Deck
Unlock for access to all 54 flashcards in this deck.
Unlock Deck
k this deck
8
What is meant by time compression in a simulation model?
Unlock Deck
Unlock for access to all 54 flashcards in this deck.
Unlock Deck
k this deck
9
Which one of the following statements regarding simulation analysis is FALSE?
A)Simulation analysis is a form of hypothesis testing.
B)In simulation,dependent variables reflect the values of both the decision variables and the uncontrollable variables.
C)Statistical methods require the replication of simulation runs.
D)Each time a simulation model is run for a given set of decision variables,the same random numbers must be used.
Unlock Deck
Unlock for access to all 54 flashcards in this deck.
Unlock Deck
k this deck
10
Random variables are under the control of the decision maker.
Unlock Deck
Unlock for access to all 54 flashcards in this deck.
Unlock Deck
k this deck
11
The manager of a branch bank wants to build a simulation model of the lobby operation to reduce the waiting time of her customers.The number of customers arriving at any point of time is an example of a(n):
A)decision variable.
B)uncontrollable variable.
C)time-compressed variable.
D)dependent variable.
A)decision variable.
B)uncontrollable variable.
C)time-compressed variable.
D)dependent variable.
Unlock Deck
Unlock for access to all 54 flashcards in this deck.
Unlock Deck
k this deck
12
Simulation is the process of reproducing the behavior of a system using a model that describes the processes of the system.
Unlock Deck
Unlock for access to all 54 flashcards in this deck.
Unlock Deck
k this deck
13
A manager has been given the table shown below and is asked to generate random numbers.Which of the following statements is TRUE?
A)There are no customers in the store 49 percent of the time.
B)The probability of having one customer in the store is 0.30.
C)The relative frequency of having two customers in the store is 0.80.
D)If we randomly choose the numbers 0 through 99 enough times,about 99 percent of the time we will have two customers in the store.
Unlock Deck
Unlock for access to all 54 flashcards in this deck.
Unlock Deck
k this deck
14
The manager of a branch bank wants to build a simulation model of the lobby operation to reduce the waiting time of her customers.The number of tellers is an example of:
A)a decision variable.
B)an uncontrollable variable.
C)a time-compressed variable.
D)a dependent variable.
A)a decision variable.
B)an uncontrollable variable.
C)a time-compressed variable.
D)a dependent variable.
Unlock Deck
Unlock for access to all 54 flashcards in this deck.
Unlock Deck
k this deck
15
Time compression is the feature of simulation that allows managers to obtain operating-characteristic estimates in much less time than is required to gather the same operating data from a real system.
Unlock Deck
Unlock for access to all 54 flashcards in this deck.
Unlock Deck
k this deck
16
________ is the act of reproducing the behavior of a system using a model that describes the processes of the system.
Unlock Deck
Unlock for access to all 54 flashcards in this deck.
Unlock Deck
k this deck
17
What are the motivations for using simulation for analyzing processes?
Unlock Deck
Unlock for access to all 54 flashcards in this deck.
Unlock Deck
k this deck
18
Which one of the following relationships is CORRRECT?
A)Decision variables reflect the value of uncontrollable variables.
B)Dependent variables reflect the value of decision and uncontrollable variables.
C)Uncontrollable variables reflect the value of decision variables.
D)Uncontrollable variables reflect the values of dependent variables.
A)Decision variables reflect the value of uncontrollable variables.
B)Dependent variables reflect the value of decision and uncontrollable variables.
C)Uncontrollable variables reflect the value of decision variables.
D)Uncontrollable variables reflect the values of dependent variables.
Unlock Deck
Unlock for access to all 54 flashcards in this deck.
Unlock Deck
k this deck
19
What is the difference between a waiting line model as described in Supplement B and a simulation model of a waiting line problem?
Unlock Deck
Unlock for access to all 54 flashcards in this deck.
Unlock Deck
k this deck
20
Any random number has the same likelihood of being selected as any other,regardless of how recently it has been selected.
Unlock Deck
Unlock for access to all 54 flashcards in this deck.
Unlock Deck
k this deck
21
How can random numbers be generated?
Unlock Deck
Unlock for access to all 54 flashcards in this deck.
Unlock Deck
k this deck
22
In Excel,typing the function ________ will generate random numbers within the interval 0 to 1.
Unlock Deck
Unlock for access to all 54 flashcards in this deck.
Unlock Deck
k this deck
23
This table shows the distribution of grades in an operations management class. Add a column to the table that shows the cumulative probability and indicate what letter grade is obtained when the RAND()function is equal to 0.7406
A)A
B)B
C)C
D)D
Add a column to the table that shows the cumulative probability and indicate what letter grade is obtained when the RAND()function is equal to 0.7406A)A
B)B
C)C
D)D
Unlock Deck
Unlock for access to all 54 flashcards in this deck.
Unlock Deck
k this deck
24
If the data needed to set up a simulation are available in company records,the technique used to obtain them is called ________.
Unlock Deck
Unlock for access to all 54 flashcards in this deck.
Unlock Deck
k this deck
25
This table shows the distribution of grades in an operations management class. Add a column to the table that shows the cumulative probability and indicate what letter grade is obtained when the RAND()function is equal to 0.982245
A)A
B)B
C)C
D)D
Add a column to the table that shows the cumulative probability and indicate what letter grade is obtained when the RAND()function is equal to 0.982245A)A
B)B
C)C
D)D
Unlock Deck
Unlock for access to all 54 flashcards in this deck.
Unlock Deck
k this deck
26
To generate 100 random numbers in an Excel simulation,the "=RAND()" function is first typed into the A1 cell on an Excel spreadsheet.A1 can then be copied and pasted in a rectangular area on the spreadsheet to cover the cells:
A)A1:E5.
B)A1:H12.
C)A1:J10.
D)A1:E22.
A)A1:E5.
B)A1:H12.
C)A1:J10.
D)A1:E22.
Unlock Deck
Unlock for access to all 54 flashcards in this deck.
Unlock Deck
k this deck
27
A simulation model is used to test the impact of the number of sample customers at a supermarket.As the model is run,the decision maker watches the average number of customers in the store rapidly increase from zero until it levels off and holds a constant value.The simulation model is:
A)not valid due to the lack of change.
B)in steady state.
C)not valid due to the fluctuation in the statistics.
D)a random variable.
A)not valid due to the lack of change.
B)in steady state.
C)not valid due to the fluctuation in the statistics.
D)a random variable.
Unlock Deck
Unlock for access to all 54 flashcards in this deck.
Unlock Deck
k this deck
28
To generate 80 random numbers in an Excel simulation,the "=RAND()" function is first typed into the C2 cell on an Excel spreadsheet.C2 is then copied and pasted in a rectangular area on the spreadsheet to cover the cells:
A)C2:G13.
B)C2:J11.
C)C2:F20.
D)C2:D40.
A)C2:G13.
B)C2:J11.
C)C2:F20.
D)C2:D40.
Unlock Deck
Unlock for access to all 54 flashcards in this deck.
Unlock Deck
k this deck
29
Steady state occurs when the simulation is repeated over enough time that the average results for performance measures remain constant.
Unlock Deck
Unlock for access to all 54 flashcards in this deck.
Unlock Deck
k this deck
30
A number that has the same probability of being selected as any other number is a(n)________.
Unlock Deck
Unlock for access to all 54 flashcards in this deck.
Unlock Deck
k this deck
31
This table shows the distribution of grades in an operations management class. Add a column to the table that shows the cumulative probability and indicate what letter grade is obtained when the RAND()function is equal to 0.5548
A)A
B)B
C)C
D)D
Add a column to the table that shows the cumulative probability and indicate what letter grade is obtained when the RAND()function is equal to 0.5548A)A
B)B
C)C
D)D
Unlock Deck
Unlock for access to all 54 flashcards in this deck.
Unlock Deck
k this deck
32
________ are random events that the decision maker cannot control.
Unlock Deck
Unlock for access to all 54 flashcards in this deck.
Unlock Deck
k this deck
33
If the difference in results between different simulation runs results in a mathematical difference in system performance,the difference is said to be ________.
Unlock Deck
Unlock for access to all 54 flashcards in this deck.
Unlock Deck
k this deck
34
One hundred monkeys are typing in Excel spreadsheets when one of them enters =NORM.S.INV(RAND())What is the result of this monkey's function?
A)the number zero
B)random numbers evenly distributed from 0 to 1 inclusive
C)probabilities of the normal distribution function
D)z-scores from the standard normal distribution
A)the number zero
B)random numbers evenly distributed from 0 to 1 inclusive
C)probabilities of the normal distribution function
D)z-scores from the standard normal distribution
Unlock Deck
Unlock for access to all 54 flashcards in this deck.
Unlock Deck
k this deck
35
________ uses random numbers to generate simulation events.
Unlock Deck
Unlock for access to all 54 flashcards in this deck.
Unlock Deck
k this deck
36
In Excel,the RAND()function generates either a 0 or a 1,purely at random.
Unlock Deck
Unlock for access to all 54 flashcards in this deck.
Unlock Deck
k this deck
37
________ occurs when the simulation is repeated over enough time that the average results for performance measures remain constant.
Unlock Deck
Unlock for access to all 54 flashcards in this deck.
Unlock Deck
k this deck
38
When using Excel for simulation,it is important to freeze the random numbers used in order to compare the effectiveness of different policies.To do this,you must select the cells holding the random numbers with the mouse,click Edit/Copy at the top of the spreadsheet,and:
A)click Edit/Paste Special and select the Values option.
B)click Edit/Paste to freeze the cells.
C)click Edit/Paste Special and select the Formulas option.
D)move to a different section of the spreadsheet,then click Edit/Paste to freeze the cells.
A)click Edit/Paste Special and select the Values option.
B)click Edit/Paste to freeze the cells.
C)click Edit/Paste Special and select the Formulas option.
D)move to a different section of the spreadsheet,then click Edit/Paste to freeze the cells.
Unlock Deck
Unlock for access to all 54 flashcards in this deck.
Unlock Deck
k this deck
39
Why would data need to be collected prior to conducting a simulation?
Unlock Deck
Unlock for access to all 54 flashcards in this deck.
Unlock Deck
k this deck
40
A variable that is controlled by the decision-maker and will change from one run to the next as different events are simulated is a(n)________.
Unlock Deck
Unlock for access to all 54 flashcards in this deck.
Unlock Deck
k this deck
41
Scenario E.1
SimQuick is being used to simulate the following bank process: Customer arrivals at the Entrance Door of the bank with an average time between arrivals of 2.5 minutes.The Line Buffer holds 6 customers.If a customer arrives and the buffer line is filled,the customer leaves.The Work Station Teller's processing time per customer is normally distributed,with a mean of 3.0 minutes and a standard deviation of 0.5 minutes.The Served Customer Buffer in the flow chart is used to count the number of customers processed during the period simulated.A 2-hour period was simulated.
The SimQuick simulation is run,and the results are as follows:
Use the information in Scenario E.1.On average,approximately how many customers were waiting in line during the 2-hour simulation period?
A)5
B)4
C)3
D)2
SimQuick is being used to simulate the following bank process:
Customer arrivals at the Entrance Door of the bank with an average time between arrivals of 2.5 minutes.The Line Buffer holds 6 customers.If a customer arrives and the buffer line is filled,the customer leaves.The Work Station Teller's processing time per customer is normally distributed,with a mean of 3.0 minutes and a standard deviation of 0.5 minutes.The Served Customer Buffer in the flow chart is used to count the number of customers processed during the period simulated.A 2-hour period was simulated.The SimQuick simulation is run,and the results are as follows:
Use the information in Scenario E.1.On average,approximately how many customers were waiting in line during the 2-hour simulation period?
A)5
B)4
C)3
D)2
Unlock Deck
Unlock for access to all 54 flashcards in this deck.
Unlock Deck
k this deck
42
Scenario E.1
SimQuick is being used to simulate the following bank process: Customer arrivals at the Entrance Door of the bank with an average time between arrivals of 2.5 minutes.The Line Buffer holds 6 customers.If a customer arrives and the buffer line is filled,the customer leaves.The Work Station Teller's processing time per customer is normally distributed,with a mean of 3.0 minutes and a standard deviation of 0.5 minutes.The Served Customer Buffer in the flow chart is used to count the number of customers processed during the period simulated.A 2-hour period was simulated.
The SimQuick simulation is run,and the results are as follows:
Use the information in Scenario E.1.Approximately how much time did the average customer who entered the system spend waiting in line?
A)9)75 minutes
B)3)08 minutes
C)5)85 minutes
D)3)98 minutes
SimQuick is being used to simulate the following bank process:
Customer arrivals at the Entrance Door of the bank with an average time between arrivals of 2.5 minutes.The Line Buffer holds 6 customers.If a customer arrives and the buffer line is filled,the customer leaves.The Work Station Teller's processing time per customer is normally distributed,with a mean of 3.0 minutes and a standard deviation of 0.5 minutes.The Served Customer Buffer in the flow chart is used to count the number of customers processed during the period simulated.A 2-hour period was simulated.The SimQuick simulation is run,and the results are as follows:
Use the information in Scenario E.1.Approximately how much time did the average customer who entered the system spend waiting in line?
A)9)75 minutes
B)3)08 minutes
C)5)85 minutes
D)3)98 minutes
Unlock Deck
Unlock for access to all 54 flashcards in this deck.
Unlock Deck
k this deck
43
The arrival of customers at a lemonade stand is modeled in SimQuick using a(n):
A)entrance block.
B)buffer block.
C)workstation block.
D)decision point.
A)entrance block.
B)buffer block.
C)workstation block.
D)decision point.
Unlock Deck
Unlock for access to all 54 flashcards in this deck.
Unlock Deck
k this deck
44
Refer to the bank process model.The bank's process improvement group has developed a number of process and technology changes that will improve the Teller's process rate per customer from a mean of 3.0 minutes to 2.5 minutes (standard deviation remains at 0.5 minutes).The Bank Manager wants to determine if the improved process rate,along with the special promotion for new customers,will allow the "arrive and immediately leave" rate and average customer wait time in line achieved in Problem #45 to still be met (12% balk rate,9.95 minutes in line).If so,the manager will implement the process and technology changes and allow the special promotion to proceed.Using SimQuick,estimate the new arrive and immediately leave rate and average time in line.What decision should the manager make?
Unlock Deck
Unlock for access to all 54 flashcards in this deck.
Unlock Deck
k this deck
45
Scenario E.1
SimQuick is being used to simulate the following bank process: Customer arrivals at the Entrance Door of the bank with an average time between arrivals of 2.5 minutes.The Line Buffer holds 6 customers.If a customer arrives and the buffer line is filled,the customer leaves.The Work Station Teller's processing time per customer is normally distributed,with a mean of 3.0 minutes and a standard deviation of 0.5 minutes.The Served Customer Buffer in the flow chart is used to count the number of customers processed during the period simulated.A 2-hour period was simulated.
The SimQuick simulation is run,and the results are as follows:
Use the information in Scenario E.1.Approximately how many total customers arrived during the 2-hour period simulated?
A)42
B)38
C)44
D)48
SimQuick is being used to simulate the following bank process:
Customer arrivals at the Entrance Door of the bank with an average time between arrivals of 2.5 minutes.The Line Buffer holds 6 customers.If a customer arrives and the buffer line is filled,the customer leaves.The Work Station Teller's processing time per customer is normally distributed,with a mean of 3.0 minutes and a standard deviation of 0.5 minutes.The Served Customer Buffer in the flow chart is used to count the number of customers processed during the period simulated.A 2-hour period was simulated.The SimQuick simulation is run,and the results are as follows:
Use the information in Scenario E.1.Approximately how many total customers arrived during the 2-hour period simulated?
A)42
B)38
C)44
D)48
Unlock Deck
Unlock for access to all 54 flashcards in this deck.
Unlock Deck
k this deck
46
SimQuick is to be used to simulate the following bank process: Customers arrive at the Entrance Door of the bank with an average time between arrivals of 2.5 minutes The Line Buffer holds 6 customers.If a customer arrives and the buffer line is filled,the customer leaves.The Work Station Teller's processing time per customer is normally distributed,with a mean of 3.0 minutes and a standard deviation of 0.5 minutes.The Served Customer Buffer in the flowchart is used to count the number of customers processed during the simulation period.A 2-hour period is to be simulated and the simulation should be repeated 30 times.Determine:
a)The number of customers served during the 2-hour period;
b)The percentage of customers who arrived at the bank and left because the buffer line was full;
c)The utilization of the teller (% of time working)during the 2-hour period;
Customers arrive at the Entrance Door of the bank with an average time between arrivals of 2.5 minutes The Line Buffer holds 6 customers.If a customer arrives and the buffer line is filled,the customer leaves.The Work Station Teller's processing time per customer is normally distributed,with a mean of 3.0 minutes and a standard deviation of 0.5 minutes.The Served Customer Buffer in the flowchart is used to count the number of customers processed during the simulation period.A 2-hour period is to be simulated and the simulation should be repeated 30 times.Determine:a)The number of customers served during the 2-hour period;
b)The percentage of customers who arrived at the bank and left because the buffer line was full;
c)The utilization of the teller (% of time working)during the 2-hour period;
Unlock Deck
Unlock for access to all 54 flashcards in this deck.
Unlock Deck
k this deck
47
A patient's interminable wait for the first available physician is modeled in SimQuick using a(n):
A)entrance block.
B)buffer block.
C)workstation block.
D)decision point.
A)entrance block.
B)buffer block.
C)workstation block.
D)decision point.
Unlock Deck
Unlock for access to all 54 flashcards in this deck.
Unlock Deck
k this deck
48
Scenario E.1
SimQuick is being used to simulate the following bank process: Customer arrivals at the Entrance Door of the bank with an average time between arrivals of 2.5 minutes.The Line Buffer holds 6 customers.If a customer arrives and the buffer line is filled,the customer leaves.The Work Station Teller's processing time per customer is normally distributed,with a mean of 3.0 minutes and a standard deviation of 0.5 minutes.The Served Customer Buffer in the flow chart is used to count the number of customers processed during the period simulated.A 2-hour period was simulated.
The SimQuick simulation is run,and the results are as follows:
Use the information in Scenario E.1.Approximately what percentage of total customers who arrived during the 2-hour period found the buffer full and were not able to enter?
A)87%
B)13%
C)94%
D)6%
SimQuick is being used to simulate the following bank process:
Customer arrivals at the Entrance Door of the bank with an average time between arrivals of 2.5 minutes.The Line Buffer holds 6 customers.If a customer arrives and the buffer line is filled,the customer leaves.The Work Station Teller's processing time per customer is normally distributed,with a mean of 3.0 minutes and a standard deviation of 0.5 minutes.The Served Customer Buffer in the flow chart is used to count the number of customers processed during the period simulated.A 2-hour period was simulated.The SimQuick simulation is run,and the results are as follows:
Use the information in Scenario E.1.Approximately what percentage of total customers who arrived during the 2-hour period found the buffer full and were not able to enter?
A)87%
B)13%
C)94%
D)6%
Unlock Deck
Unlock for access to all 54 flashcards in this deck.
Unlock Deck
k this deck
49
What is steady state in a simulation model? Why is it important to achieve steady state?
Unlock Deck
Unlock for access to all 54 flashcards in this deck.
Unlock Deck
k this deck
50
Describe a general procedure for generating normally distributed random numbers with a mean of 450 and standard deviation of 50 using Excel functions.
Unlock Deck
Unlock for access to all 54 flashcards in this deck.
Unlock Deck
k this deck
51
Which of the following statements about SimQuick is TRUE?
A)SimQuick requires some knowledge of programming languages,such as VISUAL BASIC or C++.
B)SimQuick can be used to simulate the flow of materials,but cannot be used to study the process flows that involve people or information.
C)SimQuick is an easy-to-use package that is simply an Excel spreadsheet with some macros.
D)The primary disadvantage of SimQuick is that it is more costly and more difficult to set up when compared to other models,such as SIMPROCESS and ProModel.
Unlock Deck
Unlock for access to all 54 flashcards in this deck.
Unlock Deck
k this deck
52
Refer to the bank process model.The Marketing Department for the bank has decided to run a special promotion for new customers that will increase the number of customers arriving at the bank.The new arrival rate is expected to be an average time between arrivals of 2.0 minutes instead of the current average time between arrivals of 2.5 minutes.With the potential increase in business,the bank manager is concerned about the number of customers who will arrive and leave because the line is full (with 6 customers)and the average wait time in line at the bank.All other parameters of the model remain the same.Using SimQuick,estimate the new arrive and immediately leave rate and average time in line.Should the manager be concerned?
Unlock Deck
Unlock for access to all 54 flashcards in this deck.
Unlock Deck
k this deck
53
Big Bills McGee carries no paper money less than $10 in his wallet,preferring to have a ready supply of $10,$20,$50,and $100 denominations at all times.He is concerned about pickpockets and has an amusing anecdote about thwarting a pickpocket on the Athens subway he likes to tell.His business associate conducts a Monte Carlo simulation for Big Bills using POM for Windows software and prints out the results copied below.Using this output,provide your interpretation for Big Bills pickpocket scenario.
Unlock Deck
Unlock for access to all 54 flashcards in this deck.
Unlock Deck
k this deck
54
SimQuick can be used to simulate all of the following EXCEPT:
A)a call center with completely random call arrivals and processing times.
B)a hospital emergency room with arrivals that vary during different time periods throughout the day.
C)a manufacturing process with a constant arrival rate (e.g. ,every 2 minutes)at one of the process steps.
D)the hiring of production workers,based on skill requirements throughout the year.
Unlock Deck
Unlock for access to all 54 flashcards in this deck.
Unlock Deck
k this deck
Unlock Deck
Unlock for access to all 54 flashcards in this deck.


