Exam 20: Simulation
Exam 1: Using Operations to Create Value100 Questions
Exam 2: Process Strategy and Analysis245 Questions
Exam 3: Quality and Performance195 Questions
Exam 4: Capacity Planning108 Questions
Exam 5: Constraint Management136 Questions
Exam 6: Lean Systems164 Questions
Exam 7: Project Management140 Questions
Exam 8: Forecasting150 Questions
Exam 9: Inventory Management207 Questions
Exam 10: Operations Planning and Scheduling149 Questions
Exam 11: Resource Planning125 Questions
Exam 12: Supply Chain Design77 Questions
Exam 13: Supply Chain Logistic Networks114 Questions
Exam 14: Supply Chain Integration111 Questions
Exam 15: Supply Chain Sustainability73 Questions
Exam 16: Decision Making107 Questions
Exam 17: Waiting Lines108 Questions
Exam 18: Special Inventory Models53 Questions
Exam 19: Linear Programming86 Questions
Exam 20: Simulation54 Questions
Exam 21: Financial Analysis55 Questions
Exam 22: Acceptance Sampling Plans87 Questions
Exam 23: Measuring Output Rates106 Questions
Exam 24: Learning Curve Analysis51 Questions
Exam 25: Operations Scheduling120 Questions
Exam 26: Layout36 Questions
Select questions type
________ is the act of reproducing the behavior of a system using a model that describes the processes of the system.
Free
(Essay)
4.7/5  (34)
(34)
Correct Answer: Verified
Simulation
________ uses random numbers to generate simulation events.
Free
(Essay)
4.7/5 (34)
Correct Answer:Verified
Monte Carlo
Scenario E.1
SimQuick is being used to simulate the following bank process: 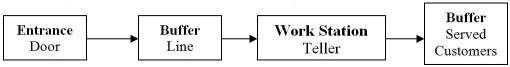 Customer arrivals at the Entrance Door of the bank with an average time between arrivals of 2.5 minutes.The Line Buffer holds 6 customers.If a customer arrives and the buffer line is filled,the customer leaves.The Work Station Teller's processing time per customer is normally distributed,with a mean of 3.0 minutes and a standard deviation of 0.5 minutes.The Served Customer Buffer in the flow chart is used to count the number of customers processed during the period simulated.A 2-hour period was simulated.
The SimQuick simulation is run,and the results are as follows:
Customer arrivals at the Entrance Door of the bank with an average time between arrivals of 2.5 minutes.The Line Buffer holds 6 customers.If a customer arrives and the buffer line is filled,the customer leaves.The Work Station Teller's processing time per customer is normally distributed,with a mean of 3.0 minutes and a standard deviation of 0.5 minutes.The Served Customer Buffer in the flow chart is used to count the number of customers processed during the period simulated.A 2-hour period was simulated.
The SimQuick simulation is run,and the results are as follows:
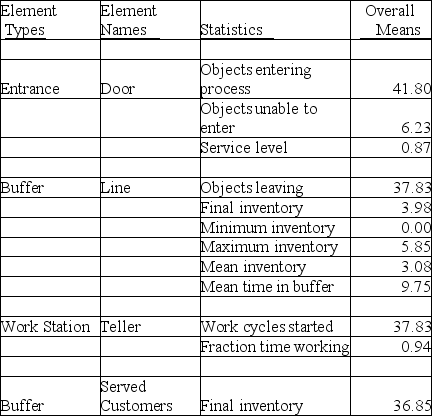 -Use the information in Scenario E.1.Approximately how many total customers arrived during the 2-hour period simulated?
Free
(Multiple Choice)
4.7/5 (29)
Correct Answer:Verified
D
Using a simulation model to gather a year of operating data in a few minutes is known as:
(Multiple Choice)
4.8/5 (28)
What are the differences between decision variables and uncontrolled variables? Describe the differences and provide an example from a simulation model.
(Essay)
4.8/5 (39)
Steady state occurs when the simulation is repeated over enough time that the average results for performance measures remain constant.
(True/False)
4.9/5 (46)
Scenario E.1
SimQuick is being used to simulate the following bank process: Customer arrivals at the Entrance Door of the bank with an average time between arrivals of 2.5 minutes.The Line Buffer holds 6 customers.If a customer arrives and the buffer line is filled,the customer leaves.The Work Station Teller's processing time per customer is normally distributed,with a mean of 3.0 minutes and a standard deviation of 0.5 minutes.The Served Customer Buffer in the flow chart is used to count the number of customers processed during the period simulated.A 2-hour period was simulated.
The SimQuick simulation is run,and the results are as follows:
-Use the information in Scenario E.1.Approximately how much time did the average customer who entered the system spend waiting in line?
(Multiple Choice)
4.8/5 (38)
When using Excel for simulation,it is important to freeze the random numbers used in order to compare the effectiveness of different policies.To do this,you must select the cells holding the random numbers with the mouse,click Edit/Copy at the top of the spreadsheet,and:
(Multiple Choice)
4.9/5 (35)
Refer to the bank process model.The bank's process improvement group has developed a number of process and technology changes that will improve the Teller's process rate per customer from a mean of 3.0 minutes to 2.5 minutes (standard deviation remains at 0.5 minutes).The Bank Manager wants to determine if the improved process rate,along with the special promotion for new customers,will allow the "arrive and immediately leave" rate and average customer wait time in line achieved in Problem #45 to still be met (12% balk rate,9.95 minutes in line).If so,the manager will implement the process and technology changes and allow the special promotion to proceed.Using SimQuick,estimate the new arrive and immediately leave rate and average time in line.What decision should the manager make?
(Essay)
4.7/5 (43)
________ occurs when the simulation is repeated over enough time that the average results for performance measures remain constant.
(Essay)
4.8/5 (29)
This table shows the distribution of grades in an operations management class. 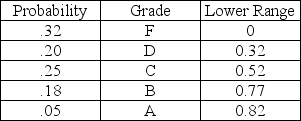 Add a column to the table that shows the cumulative probability and indicate what letter grade is obtained when the RAND()function is equal to 0.7406
(Multiple Choice)
4.8/5 (37)
SimQuick can be used to simulate all of the following EXCEPT:
(Multiple Choice)
4.7/5 (33)
What is steady state in a simulation model? Why is it important to achieve steady state?
(Essay)
4.7/5 (34)
Monte Carlo simulation is the use of computer graphics to show customers or products moving through a series of process steps.
(True/False)
4.8/5 (35)
The manager of a branch bank wants to build a simulation model of the lobby operation to reduce the waiting time of her customers.The number of customers waiting in line at any point of time is an example of a(n):
(Multiple Choice)
4.8/5 (24)
To generate 80 random numbers in an Excel simulation,the "=RAND()" function is first typed into the C2 cell on an Excel spreadsheet.C2 is then copied and pasted in a rectangular area on the spreadsheet to cover the cells:
(Multiple Choice)
4.8/5 (34)
What is the difference between a waiting line model as described in Supplement B and a simulation model of a waiting line problem?
(Essay)
4.7/5 (41)
Filters
- Essay(0)
- Multiple Choice(0)
- Short Answer(0)
- True False(0)
- Matching(0)