Deck 7: Perfect Competition
Full screen (f)
Question
Question
Question
Question
Question
Question
Question
Question
Question
Question
Question
Question
Question
Question
Question
Question
Question
Question
Question
Question
Question
Question
Question
Question
The following figure shows the domestic demand and supply curves for a good. With free trade, the price of the good in the domestic market is P3. The government introduces a 5% tariff in the market which raises the domestic price to P2.
Figure 7-1
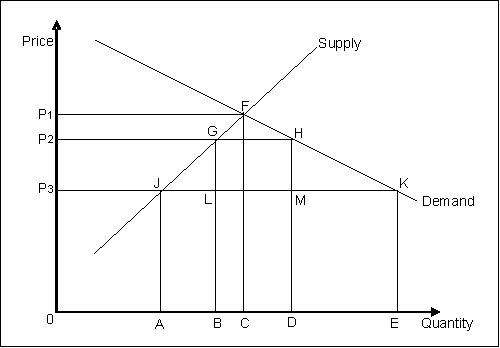
Refer to Figure 7-1. The increase in the government's revenue due to the imposition of a tariff is equal to:
A) the area of GFHML.
B) the area of GHKJ.
C) the area of P1FKP3.
D) the area of GHML.
E) the area of P2HKP3.
Figure 7-1
Refer to Figure 7-1. The increase in the government's revenue due to the imposition of a tariff is equal to:
A) the area of GFHML.
B) the area of GHKJ.
C) the area of P1FKP3.
D) the area of GHML.
E) the area of P2HKP3.
Question
Question
Question
Question
The following figure shows the domestic demand and supply curves for a good. With free trade, the price of the good in the domestic market is P3. The government introduces a 5% tariff in the market which raises the domestic price to P2.
Figure 7-1
Refer to Figure 7-1. With the imposition of the tariff, the change in producer surplus is equal to:
A) a loss measured by the area of P1FGP2.
B) a gain measured by the area of P1FJP3.
C) a gain measured by the area of P2GJP3.
D) a loss measured by the area of P3JA0.
E) a gain measured by the area of P1FC0.
Question
The following figure shows the domestic demand and supply curves for a good. With free trade, the price of the good in the domestic market is P3. The government introduces a 5% tariff in the market which raises the domestic price to P2.
Figure 7-1
Refer to Figure 7-1. With the imposition of the tariff, the change in consumer surplus is equal to:
A) a loss measured by the area of P2GLP3.
B) a gain measured by the area of P2GJP3.
C) a loss measured by the area of P2HKP3.
D) a gain measured by the area of P1FJP3.
E) a loss measured by the area of P1FGP2.
Question
Question
The following figure shows the domestic demand and supply curves for a good. With free trade, the price of the good in the domestic market is P3. The government introduces a 5% tariff in the market which raises the domestic price to P2.
Figure 7-1
Refer to Figure 7-1. With the imposition of the tariff, the level of imports to the domestic market is:
A) CD.
B) AE.
C) 0.
D) AC.
E) BD.
Figure 7-1
Refer to Figure 7-1. With the imposition of the tariff, the level of imports to the domestic market is:
A) CD.
B) AE.
C) 0.
D) AC.
E) BD.
Question
Question
Question
The following figure shows the domestic demand and supply curves for a good. With free trade, the price of the good in the domestic market is P3. The government introduces a 5% tariff in the market which raises the domestic price to P2.
Figure 7-1
Refer to Figure 7-1. When trade is not restricted, the level of imports to the domestic market is _____.
A) CD
B) AE
C) 0
D) BD
E) AC
Figure 7-1
Refer to Figure 7-1. When trade is not restricted, the level of imports to the domestic market is _____.
A) CD
B) AE
C) 0
D) BD
E) AC
Question
The following figure shows the domestic demand and supply curves for a good. With free trade, the price of the good in the domestic market is P3. The government introduces a 5% tariff in the market which raises the domestic price to P2.
Figure 7-1
Refer to Figure 7-1. If the government substitutes the tariff for a quota that raises the price in the domestic price to P2, the deadweight loss in the market would be equal to:
A) the area of GHLM.
B) the area of GHKJ.
C) the area of HMK.
D) the area of JGL.
E) the area of JGL + HMK.
Figure 7-1
Refer to Figure 7-1. If the government substitutes the tariff for a quota that raises the price in the domestic price to P2, the deadweight loss in the market would be equal to:
A) the area of GHLM.
B) the area of GHKJ.
C) the area of HMK.
D) the area of JGL.
E) the area of JGL + HMK.
Question
Question
Question
The following figure shows the domestic demand and supply curves for a good. With free trade, the price of the good in the domestic market is P3. The government introduces a 5% tariff in the market which raises the domestic price to P2.
Figure 7-1
Refer to Figure 7-1. With the imposition of the tariff, the deadweight loss in the market is equal to:
A) the area of FGH.
B) the area of JGL + HMK.
C) the area of HMK.
D) the area of FJK.
E) the area of JABL + MKED.
Figure 7-1
Refer to Figure 7-1. With the imposition of the tariff, the deadweight loss in the market is equal to:
A) the area of FGH.
B) the area of JGL + HMK.
C) the area of HMK.
D) the area of FJK.
E) the area of JABL + MKED.
Question
Question
Question
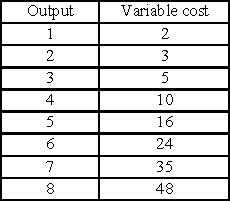
A firm operates in a competitive industry, in which the price is $8 per unit. Its fixed cost is $10 and its variable costs are given in the table. Compute the firm's revenues and costs for output over the range 0 to 8 units. Determine the profit-maximizing level of output for the firm. If this firm is typical of the industry, will entry occur? Explain why or why not.
Question
Question
Question
Question
Question
Question
Question
Question
Question
Question
Question
Question
Question

Unlock Deck
Sign up to unlock the cards in this deck!
Unlock Deck
Unlock Deck
1/54
Play
Full screen (f)
Deck 7: Perfect Competition
1
Everything else remaining unchanged, an increase in demand will lead to:
A) a leftward shift of the supply curve and a consequent fall in price.
B) an upward movement along the demand curve.
C) a rightward shift of the demand curve.
D) an increase in output and a fall in price.
E) a downward movement along the demand curve.
A) a leftward shift of the supply curve and a consequent fall in price.
B) an upward movement along the demand curve.
C) a rightward shift of the demand curve.
D) an increase in output and a fall in price.
E) a downward movement along the demand curve.
C
2
The height of an individual demand curve at each level of output shows:
A) the marginal cost of producing the good.
B) the marginal benefit from consuming an extra unit of the good.
C) the value of consumer surplus.
D) the value of producer surplus.
E) the revenue earned by the firm from an additional unit consumed.
A) the marginal cost of producing the good.
B) the marginal benefit from consuming an extra unit of the good.
C) the value of consumer surplus.
D) the value of producer surplus.
E) the revenue earned by the firm from an additional unit consumed.
B
3
The price of fresh fish rose and the quantity sold fell. Other things remaining the same, which of the following is consistent with this observation?
A) The number of consumers that have a preference for fish increased.
B) The price of meat, which is a substitute for fish, rose.
C) The fishermen learned to fish more efficiently.
D) The cost of fishing increased.
E) The supply of fresh fish increased.
A) The number of consumers that have a preference for fish increased.
B) The price of meat, which is a substitute for fish, rose.
C) The fishermen learned to fish more efficiently.
D) The cost of fishing increased.
E) The supply of fresh fish increased.
D
4
If the long-run market supply curve in a perfectly competitive industry is upward sloping, then the industry:
A) is a constant-cost industry.
B) is an increasing-cost industry.
C) exhibits constant returns to scale.
D) exhibits increasing returns to scale.
E) is a decreasing-cost industry.
A) is a constant-cost industry.
B) is an increasing-cost industry.
C) exhibits constant returns to scale.
D) exhibits increasing returns to scale.
E) is a decreasing-cost industry.
Unlock Deck
Unlock for access to all 54 flashcards in this deck.
Unlock Deck
k this deck
5
In the long run, firms in a perfectly competitive industry are most likely to:
A) earn negative economic profits and exit the market.
B) have a positively sloped average revenue curve.
C) suppress innovative products to earn a positive economic profit.
D) continue to earn positive economic profit because of barriers to entry.
E) earn zero economic profits and produce at minimum cost.
Unlock Deck
Unlock for access to all 54 flashcards in this deck.
Unlock Deck
k this deck
6
In order to maximize profits, a perfectly competitive firm will continue producing until:
A) it utilizes its full production capacity.
B) the marginal cost equals the market price.
C) the average cost is minimized.
D) its total sales revenue is maximized.
E) the profit per-unit is at its highest possible point.
A) it utilizes its full production capacity.
B) the marginal cost equals the market price.
C) the average cost is minimized.
D) its total sales revenue is maximized.
E) the profit per-unit is at its highest possible point.
Unlock Deck
Unlock for access to all 54 flashcards in this deck.
Unlock Deck
k this deck
7
In the long run, perfectly competitive firms are in equilibrium when:
A) long-run average cost is at its maximum.
B) price is equal to the long-run marginal cost.
C) price is less than the long-run average cost.
D) the long-run average cost curve slopes upward.
E) price exceeds long-run marginal cost.
A) long-run average cost is at its maximum.
B) price is equal to the long-run marginal cost.
C) price is less than the long-run average cost.
D) the long-run average cost curve slopes upward.
E) price exceeds long-run marginal cost.
Unlock Deck
Unlock for access to all 54 flashcards in this deck.
Unlock Deck
k this deck
8
Suppose that demand for and supply of a commodity in a market are shown on a graph with price on the vertical axis and quantity on the horizontal axis. The y-intercept of the demand curve is equal to $30. The equilibrium price and quantity are $20 and 300 units respectively. What is the total consumer surplus in the market?
A) $2,000
B) $1,300
C) $9,000
D) $3,000
E) $1,500
A) $2,000
B) $1,300
C) $9,000
D) $3,000
E) $1,500
Unlock Deck
Unlock for access to all 54 flashcards in this deck.
Unlock Deck
k this deck
9
Suppose a severe freeze damages the Florida orange crop. Everything else remaining unchanged, which of the following is most likely to be true?
A) Because of the shortage of oranges, consumers will reduce their demand in order to economize.
B) The supply curve for oranges will shift to the right.
C) Both the output and the price of oranges will decrease.
D) Both the supply curve and the demand curve for oranges will shift to the left.
E) The output of oranges will fall and the price will increase.
Unlock Deck
Unlock for access to all 54 flashcards in this deck.
Unlock Deck
k this deck
10
The goods produced by firms in a perfectly competitive market are:
A) perfect complements of each other.
B) highly differentiated from each other.
C) imperfect substitutes.
D) perfectly identical to each other.
E) sold at different prices in different market segments.
A) perfect complements of each other.
B) highly differentiated from each other.
C) imperfect substitutes.
D) perfectly identical to each other.
E) sold at different prices in different market segments.
Unlock Deck
Unlock for access to all 54 flashcards in this deck.
Unlock Deck
k this deck
11
What is meant by consumer surplus?
A) It is the net gain that buyers obtain from purchasing a good.
B) It is the area enclosed by the demand and supply curves.
C) It is the difference between the good's price and its cost per unit.
D) It is the maximum monetary amount that a person would be willing to pay for a good.
E) It is the total satisfaction from the consumption of a good.
Unlock Deck
Unlock for access to all 54 flashcards in this deck.
Unlock Deck
k this deck
12
Which of the following is true of a competitive market?
A) The outcome of a competitive market is fair and equitable.
B) Competitive markets yield efficient outcomes.
C) Competitive markets allow consumers to gain at the expense of producers.
D) Competitive markets provide significant economic profits to producers in the long run.
E) Competitive markets promote business by allowing producers to gain at the expense of consumers.
Unlock Deck
Unlock for access to all 54 flashcards in this deck.
Unlock Deck
k this deck
13
The supply curve of a perfectly competitive firm is:
A) the portion of the marginal cost curve above the marginal revenue curve.
B) the portion of the marginal cost curve above the average cost curve.
C) the portion of the marginal cost curve above the average variable cost curve.
D) the portion of the average cost curve above the average variable cost curve.
E) the same as the average variable cost curve.
Unlock Deck
Unlock for access to all 54 flashcards in this deck.
Unlock Deck
k this deck
14
Demand for a good is given by: QD = 100 - P and supply by QS = .5P - 20, where P is the market price of the good. In equilibrium, price and output under perfect competition will be:
A) $60 and 10 units respectively.
B) $80 and 20 units respectively.
C) $70 and 30 units respectively.
D) $100 and 30 units respectively.
E) $120 and 35 units respectively.
A) $60 and 10 units respectively.
B) $80 and 20 units respectively.
C) $70 and 30 units respectively.
D) $100 and 30 units respectively.
E) $120 and 35 units respectively.
Unlock Deck
Unlock for access to all 54 flashcards in this deck.
Unlock Deck
k this deck
15
In a perfectly competitive market, an individual firm faces a demand curve that:
A) is downward sloping.
B) lies above the marginal revenue curve.
C) is horizontal at the equilibrium price.
D) is perfectly inelastic.
E) is upward sloping.
A) is downward sloping.
B) lies above the marginal revenue curve.
C) is horizontal at the equilibrium price.
D) is perfectly inelastic.
E) is upward sloping.
Unlock Deck
Unlock for access to all 54 flashcards in this deck.
Unlock Deck
k this deck
16
Everything else remaining unchanged, an increase in the supply of a good will lead to:
A) a fall in price and an increase in consumption of the good.
B) an increase in the cost of production of the good.
C) an increase in the price of the good.
D) a leftward shift of the supply curve.
E) an upward movement along the supply curve.
A) a fall in price and an increase in consumption of the good.
B) an increase in the cost of production of the good.
C) an increase in the price of the good.
D) a leftward shift of the supply curve.
E) an upward movement along the supply curve.
Unlock Deck
Unlock for access to all 54 flashcards in this deck.
Unlock Deck
k this deck
17
Coal is an input in the production of oil. Suppose that over the last 3 months, the price of oil has increased and the quantity sold of oil has fallen. Other things remaining the same, which of the following is most likely to be true?
A) There was a decrease in the demand for oil.
B) Coal miners received large wage increases.
C) Coal producers installed more efficient coal mining equipment.
D) New mine operators entered the coal industry.
E) New firms entered the market for oil.
A) There was a decrease in the demand for oil.
B) Coal miners received large wage increases.
C) Coal producers installed more efficient coal mining equipment.
D) New mine operators entered the coal industry.
E) New firms entered the market for oil.
Unlock Deck
Unlock for access to all 54 flashcards in this deck.
Unlock Deck
k this deck
18
Other factors being unchanged, the supply curve for eggs will shift downward and to the right if:
A) a virus spreads through poultry farms through the country and kills millions of chickens.
B) new research establishes that cholesterol, found in egg yolks, is found to cause heart disease.
C) the price of chicken feed falls.
D) the government introduces a new tax on poultry suppliers.
E) the average income level in the country falls due to a recession.
Unlock Deck
Unlock for access to all 54 flashcards in this deck.
Unlock Deck
k this deck
19
If the price of a good increases and is above the equilibrium price, then:
A) suppliers' inventories will build up, they will reduce output, and lower prices.
B) demand will exceed supply and there will be a shortage in the market.
C) the demand curve will shift to the left until equilibrium is established at the new higher prices.
D) the supply curve will shift to the right until equilibrium is established at the new higher price.
E) consumers will bid down the good's price, but there will be no reduction in output.
Unlock Deck
Unlock for access to all 54 flashcards in this deck.
Unlock Deck
k this deck
20
The demand curve faced by an individual firm in a competitive market, implies that the firm:
A) can influence the market price.
B) takes the market price as given.
C) can raise the market price of the good by lowering its sales.
D) can increase its profits by raising the price of the good it sells.
E) should reduce its price in order to increase sales.
A) can influence the market price.
B) takes the market price as given.
C) can raise the market price of the good by lowering its sales.
D) can increase its profits by raising the price of the good it sells.
E) should reduce its price in order to increase sales.
Unlock Deck
Unlock for access to all 54 flashcards in this deck.
Unlock Deck
k this deck
21
Explain why the demand curve for a competitive firm is horizontal.
Unlock Deck
Unlock for access to all 54 flashcards in this deck.
Unlock Deck
k this deck
22
Explain why perfectly competitive firms cannot earn positive economic profits in the long run.
Unlock Deck
Unlock for access to all 54 flashcards in this deck.
Unlock Deck
k this deck
23
Provide two examples of events that can cause a shift in industry supply. Draw a graph to illustrate your answer.
Unlock Deck
Unlock for access to all 54 flashcards in this deck.
Unlock Deck
k this deck
24
The following figure shows the domestic demand and supply curves for a good. With free trade, the price of the good in the domestic market is P3. The government introduces a 5% tariff in the market which raises the domestic price to P2.
Figure 7-1
Refer to Figure 7-1. The increase in the government's revenue due to the imposition of a tariff is equal to:
A) the area of GFHML.
B) the area of GHKJ.
C) the area of P1FKP3.
D) the area of GHML.
E) the area of P2HKP3.
Figure 7-1
Refer to Figure 7-1. The increase in the government's revenue due to the imposition of a tariff is equal to:
A) the area of GFHML.
B) the area of GHKJ.
C) the area of P1FKP3.
D) the area of GHML.
E) the area of P2HKP3.
Unlock Deck
Unlock for access to all 54 flashcards in this deck.
Unlock Deck
k this deck
25
Provide two examples of events that can cause a shift in industry demand. Draw a graph to illustrate your answer.
Unlock Deck
Unlock for access to all 54 flashcards in this deck.
Unlock Deck
k this deck
26
In a given market, demand is described by the equation QD = 1,800 - 10P and supply is described by QS = 200 + 10P.
(a) Determine the equilibrium price and quantity.
(a) Determine the equilibrium price and quantity.
Unlock Deck
Unlock for access to all 54 flashcards in this deck.
Unlock Deck
k this deck
27
The marginal cost of a firm under perfect competition is given by the equation MC = 2QF − 20. The market price is $50 per unit. Determine the firm's profit-maximizing level of output. Write down the equation for the firm's supply curve.
Unlock Deck
Unlock for access to all 54 flashcards in this deck.
Unlock Deck
k this deck
28
The following figure shows the domestic demand and supply curves for a good. With free trade, the price of the good in the domestic market is P3. The government introduces a 5% tariff in the market which raises the domestic price to P2.
Figure 7-1
Refer to Figure 7-1. With the imposition of the tariff, the change in producer surplus is equal to:
A) a loss measured by the area of P1FGP2.
B) a gain measured by the area of P1FJP3.
C) a gain measured by the area of P2GJP3.
D) a loss measured by the area of P3JA0.
E) a gain measured by the area of P1FC0.
Unlock Deck
Unlock for access to all 54 flashcards in this deck.
Unlock Deck
k this deck
29
The following figure shows the domestic demand and supply curves for a good. With free trade, the price of the good in the domestic market is P3. The government introduces a 5% tariff in the market which raises the domestic price to P2.
Figure 7-1
Refer to Figure 7-1. With the imposition of the tariff, the change in consumer surplus is equal to:
A) a loss measured by the area of P2GLP3.
B) a gain measured by the area of P2GJP3.
C) a loss measured by the area of P2HKP3.
D) a gain measured by the area of P1FJP3.
E) a loss measured by the area of P1FGP2.
Unlock Deck
Unlock for access to all 54 flashcards in this deck.
Unlock Deck
k this deck
30
With free trade, the market for a particular good or service is in equilibrium when:
A) domestic supply is at its maximum possible level.
B) there are no exports to the world market.
C) imports into the domestic market are zero.
D) the price in the world market is equal to the price in the domestic market.
E) the domestic demand for the good equals the domestic supply of the good.
A) domestic supply is at its maximum possible level.
B) there are no exports to the world market.
C) imports into the domestic market are zero.
D) the price in the world market is equal to the price in the domestic market.
E) the domestic demand for the good equals the domestic supply of the good.
Unlock Deck
Unlock for access to all 54 flashcards in this deck.
Unlock Deck
k this deck
31
The following figure shows the domestic demand and supply curves for a good. With free trade, the price of the good in the domestic market is P3. The government introduces a 5% tariff in the market which raises the domestic price to P2.
Figure 7-1
Refer to Figure 7-1. With the imposition of the tariff, the level of imports to the domestic market is:
A) CD.
B) AE.
C) 0.
D) AC.
E) BD.
Figure 7-1
Refer to Figure 7-1. With the imposition of the tariff, the level of imports to the domestic market is:
A) CD.
B) AE.
C) 0.
D) AC.
E) BD.
Unlock Deck
Unlock for access to all 54 flashcards in this deck.
Unlock Deck
k this deck
32
When all trade is prohibited in good X, the equilibrium price in the home country is PX. After free trade is instituted, the domestic country begins to import good X from the rest of the world. As a result of free trade:
A) the domestic price of good X will fall.
B) the domestic price of good X will rise.
C) the domestic price of good X will exceed the price in foreign countries.
D) the domestic price of good X will be less than the price in foreign countries.
E) the domestic producers will gain surplus at the expense of domestic consumers.
Unlock Deck
Unlock for access to all 54 flashcards in this deck.
Unlock Deck
k this deck
33
Derive the long-run supply curve of a perfectly competitive constant-cost industry. Use graphical analysis.
Unlock Deck
Unlock for access to all 54 flashcards in this deck.
Unlock Deck
k this deck
34
The following figure shows the domestic demand and supply curves for a good. With free trade, the price of the good in the domestic market is P3. The government introduces a 5% tariff in the market which raises the domestic price to P2.
Figure 7-1
Refer to Figure 7-1. When trade is not restricted, the level of imports to the domestic market is _____.
A) CD
B) AE
C) 0
D) BD
E) AC
Figure 7-1
Refer to Figure 7-1. When trade is not restricted, the level of imports to the domestic market is _____.
A) CD
B) AE
C) 0
D) BD
E) AC
Unlock Deck
Unlock for access to all 54 flashcards in this deck.
Unlock Deck
k this deck
35
The following figure shows the domestic demand and supply curves for a good. With free trade, the price of the good in the domestic market is P3. The government introduces a 5% tariff in the market which raises the domestic price to P2.
Figure 7-1
Refer to Figure 7-1. If the government substitutes the tariff for a quota that raises the price in the domestic price to P2, the deadweight loss in the market would be equal to:
A) the area of GHLM.
B) the area of GHKJ.
C) the area of HMK.
D) the area of JGL.
E) the area of JGL + HMK.
Figure 7-1
Refer to Figure 7-1. If the government substitutes the tariff for a quota that raises the price in the domestic price to P2, the deadweight loss in the market would be equal to:
A) the area of GHLM.
B) the area of GHKJ.
C) the area of HMK.
D) the area of JGL.
E) the area of JGL + HMK.
Unlock Deck
Unlock for access to all 54 flashcards in this deck.
Unlock Deck
k this deck
36
Suppose the equilibrium price of bread is $2 per loaf. What would be the efficiency implications of a government policy that prevents the price of bread from rising above $1?
A) The outcome would be inefficient since the marginal cost of producing bread is less than the marginal benefit to the consumers.
B) The outcome would be inefficient since the marginal benefit to consumers is less than the marginal cost of producing the bread.
C) The outcome would be efficient since the total benefit from consumption would be equal to the total cost of producing bread.
D) The outcome would be efficient since the total net benefits would be maximized.
E) The outcome will be efficient since the policy lowers the price of an essential item for consumers.
Unlock Deck
Unlock for access to all 54 flashcards in this deck.
Unlock Deck
k this deck
37
Derive the short-run supply curve of a firm under perfect competition.
Unlock Deck
Unlock for access to all 54 flashcards in this deck.
Unlock Deck
k this deck
38
The following figure shows the domestic demand and supply curves for a good. With free trade, the price of the good in the domestic market is P3. The government introduces a 5% tariff in the market which raises the domestic price to P2.
Figure 7-1
Refer to Figure 7-1. With the imposition of the tariff, the deadweight loss in the market is equal to:
A) the area of FGH.
B) the area of JGL + HMK.
C) the area of HMK.
D) the area of FJK.
E) the area of JABL + MKED.
Figure 7-1
Refer to Figure 7-1. With the imposition of the tariff, the deadweight loss in the market is equal to:
A) the area of FGH.
B) the area of JGL + HMK.
C) the area of HMK.
D) the area of FJK.
E) the area of JABL + MKED.
Unlock Deck
Unlock for access to all 54 flashcards in this deck.
Unlock Deck
k this deck
39
For a perfectly competitive firm, long-run average cost is: LAC = 300 - 20QF + .5QF2, where QF denotes the firm's output. Determine the firm's long-run profit-maximizing output and price.
Unlock Deck
Unlock for access to all 54 flashcards in this deck.
Unlock Deck
k this deck
40
In the short-run, the efficient industry outcome under perfect competition occurs at the level of output where:
A) MB = P = MC.
B) MB > P.
C) P > MC.
D) consumer surplus equals producer surplus
E) P = AC.
A) MB = P = MC.
B) MB > P.
C) P > MC.
D) consumer surplus equals producer surplus
E) P = AC.
Unlock Deck
Unlock for access to all 54 flashcards in this deck.
Unlock Deck
k this deck
41
A firm operates in a competitive industry, in which the price is $8 per unit. Its fixed cost is $10 and its variable costs are given in the table. Compute the firm's revenues and costs for output over the range 0 to 8 units. Determine the profit-maximizing level of output for the firm. If this firm is typical of the industry, will entry occur? Explain why or why not.
Unlock Deck
Unlock for access to all 54 flashcards in this deck.
Unlock Deck
k this deck
42
Is an efficient market allocation fair? Explain why or why not.
Unlock Deck
Unlock for access to all 54 flashcards in this deck.
Unlock Deck
k this deck
43
How can supply and demand analysis be used to measure consumer surplus? How does consumer surplus change if the market price falls?
Unlock Deck
Unlock for access to all 54 flashcards in this deck.
Unlock Deck
k this deck
44
In a perfectly competitive market, long-run average cost and long-run marginal cost are constant and equal: LAC = LMC = $8 for a typical firm. However, one of the firms discovers a technological innovation lowering its average cost and marginal cost to $7. How will this affect the equilibrium price? If all firms can take advantage of the innovation, what is the impact on the market price and industry profits?
Unlock Deck
Unlock for access to all 54 flashcards in this deck.
Unlock Deck
k this deck
45
A small nation permits free trade in good X. At the good's free-trade price of $8, domestic firms supply 6 million units and imports account for 4 million units. Recently, the small country has erected trade barriers with the result that imports have fallen to zero, price has risen to $10, and domestic supply has increased to 8 million units. Calculate the change in consumer surplus and producer surplus resulting from the trade barrier. What is the deadweight loss?
Unlock Deck
Unlock for access to all 54 flashcards in this deck.
Unlock Deck
k this deck
46
A perfectly competitive market is described by the demand curve QD= 60 - 2P, and the supply curve QS = 5P - 10. A typical firm has the total cost equation: C = 16 + 2QF + QF2. What is the equilibrium price and quantity in the market? Compute the firm's total revenue, total cost, and total profit.
Unlock Deck
Unlock for access to all 54 flashcards in this deck.
Unlock Deck
k this deck
47
In some western states in the U.S., federal water projects sell water to farmers at a fraction of the total cost to dam and transport the water, and at a fraction of the cost charged to city dwellers who draw from the same water source. Is this likely to result in economic efficiency? Explain why or why not.
Unlock Deck
Unlock for access to all 54 flashcards in this deck.
Unlock Deck
k this deck
48
A firm has the following cost function: C = 30 - 14Q + Q2. Derive the firm's supply curve from the total cost function.
Unlock Deck
Unlock for access to all 54 flashcards in this deck.
Unlock Deck
k this deck
49
How does a tariff differ from a quota? Are the welfare effects of a tariff and a quota the same?
Unlock Deck
Unlock for access to all 54 flashcards in this deck.
Unlock Deck
k this deck
50
Alex is the manager of a division of a paper firm that produces copier paper and sells it on the wholesale market. His firm's output represents about 1.5% of total copier paper sales. The wholesale price of copier paper is $3.95 per standard package. The firm's engineers report that, at projected volumes, labor costs are $1.00 per package, material costs are $2.00 per package, and other average fixed costs are about $.75 per package. What price should the firm charge for its copier paper?
Unlock Deck
Unlock for access to all 54 flashcards in this deck.
Unlock Deck
k this deck
51
Does free international trade increase economic efficiency? How do trade barriers and tariffs affect efficiency? Explain.
Unlock Deck
Unlock for access to all 54 flashcards in this deck.
Unlock Deck
k this deck
52
Draw a graph of a market in equilibrium. Describe what might cause a change in demand or supply, and how this would affect the new equilibrium. Indicate the effect on equilibrium price and quantity.
Unlock Deck
Unlock for access to all 54 flashcards in this deck.
Unlock Deck
k this deck
53
Demand for flower bouquets in a suburban town is described by: QD = 50 - 5P + 2Y, where Q is quantity, P is price per unit, and Y is an index of consumer income. Similarly, supply is described by: QS = -5 + 10P.
(a) If Y = 100, what is equilibrium price and output?
(a) If Y = 100, what is equilibrium price and output?
Unlock Deck
Unlock for access to all 54 flashcards in this deck.
Unlock Deck
k this deck
54
Discuss why many agricultural industries in the United States are primary examples of perfectly competitive markets.
Unlock Deck
Unlock for access to all 54 flashcards in this deck.
Unlock Deck
k this deck
Unlock Deck
Unlock for access to all 54 flashcards in this deck.


