
Human Resource Management 15th Edition by Robert Mathis,John Jackson,Sean Valentine ,Patricia Meglich
Edition 15ISBN: 978-1305500709Human Resource Management 15th Edition by Robert Mathis,John Jackson,Sean Valentine ,Patricia Meglich
Edition 15ISBN: 978-1305500709 Exercise 1
Calculating Incidence Rates
An organization's leaders frequently compare their safety results to other organizations in their industry and to their own organization over time. However, companies vary widely in size, making comparisons difficult and perhaps meaningless.
Take two manufacturing companies as an example:
• Company A has 2,500 employees and incurred 45 recordable accidents.
• Company B has 200 employees and incurred 7 recordable accidents.
Which company is running a safer operation? It looks like Company B because it had fewer injuries. But Company A employs a lot more workers. How can you compare the two?
There is a useful formula that easily determines the answer to this question. The incidence rate of injuries and illnesses can be computed as follows:
incidence rate
= (number of injuries and illnesses × 200,000)
÷ employee hours worked
The 200,000 hours in the formula represents the equivalent of 100 employees working 40 hours per week, 50 weeks per year and provides the standard base for the incidence rates. Therefore, no matter how many employees a company has, it is possible to compare incidence rates within an industry or over time.
So, which company is doing a better job? Let's calculate their incidence rates:
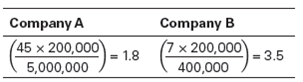
Now we can see that Company B is incurring injuries at the rate of 3.5 for every 100 workers, while Company A is incurring only 1.8 injuries for every 100 workers. So, Company A is keeping its workers safer. You can use the same formula to compute incidence rates for all recordable injuries, injuries with lost work days, and any other category of illnesses or injuries.
Each year, the Bureau of Labor Statistics publishes national incidence rates detailed by industry and employer size to help companies track their results against others in the same industry or of similar size. OSHA also uses this information to identify worksites with high incidence rates so that stepped-up enforcement and preventive action can be taken.
Now that you understand how incidence rates can be computed, answer the following questions:
How might safety committees use this information when working on accident prevention programs? Could an HR department provide any assistance?
An organization's leaders frequently compare their safety results to other organizations in their industry and to their own organization over time. However, companies vary widely in size, making comparisons difficult and perhaps meaningless.
Take two manufacturing companies as an example:
• Company A has 2,500 employees and incurred 45 recordable accidents.
• Company B has 200 employees and incurred 7 recordable accidents.
Which company is running a safer operation? It looks like Company B because it had fewer injuries. But Company A employs a lot more workers. How can you compare the two?
There is a useful formula that easily determines the answer to this question. The incidence rate of injuries and illnesses can be computed as follows:
incidence rate
= (number of injuries and illnesses × 200,000)
÷ employee hours worked
The 200,000 hours in the formula represents the equivalent of 100 employees working 40 hours per week, 50 weeks per year and provides the standard base for the incidence rates. Therefore, no matter how many employees a company has, it is possible to compare incidence rates within an industry or over time.
So, which company is doing a better job? Let's calculate their incidence rates:
Now we can see that Company B is incurring injuries at the rate of 3.5 for every 100 workers, while Company A is incurring only 1.8 injuries for every 100 workers. So, Company A is keeping its workers safer. You can use the same formula to compute incidence rates for all recordable injuries, injuries with lost work days, and any other category of illnesses or injuries.
Each year, the Bureau of Labor Statistics publishes national incidence rates detailed by industry and employer size to help companies track their results against others in the same industry or of similar size. OSHA also uses this information to identify worksites with high incidence rates so that stepped-up enforcement and preventive action can be taken.
Now that you understand how incidence rates can be computed, answer the following questions:
How might safety committees use this information when working on accident prevention programs? Could an HR department provide any assistance?
Explanation Verified
Calculation of incidence rates in an org...
Human Resource Management 15th Edition by Robert Mathis,John Jackson,Sean Valentine ,Patricia Meglich
Why don’t you like this exercise?
Other Minimum 8 character and maximum 255 character
Character 255


