
Managing for Quality and Performance Excellence 9th Edition by James Evans,William Lindsay
Edition 9ISBN: 978-1285069463Managing for Quality and Performance Excellence 9th Edition by James Evans,William Lindsay
Edition 9ISBN: 978-1285069463 Exercise 56
The Joint Commission Accreditation of Health Care Organizations (JCAHO) monitors and evaluates health care providers according to strict standards and guidelines. Improvement in the quality of care is a principal concern. Hospitals are required to identify and monitor important quality indicators that affect patient care and establish "thresholds for evaluation" (TFEs), which are levels at which special investigation of problems should occur. TFEs provide a means of focusing attention on nonrandom errors (that is, special causes of variation). A logical way to set TFEs is through control charts.
TABLE 8.8 Monthly Data on Infections After Surgery
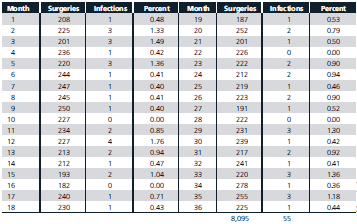
Suppose that Hallenvale Hospital collects monthly data on the number of infections after surgeries. These data are shown in Table 8.8. Hospital administrators are concerned about whether the high percentages of infections (such as 1.76 percent in month 12) are caused by factors other than randomness.
Using the data in Table 8.8, what is the average percentage of infections?
TABLE 8.8 Monthly Data on Infections After Surgery
Suppose that Hallenvale Hospital collects monthly data on the number of infections after surgeries. These data are shown in Table 8.8. Hospital administrators are concerned about whether the high percentages of infections (such as 1.76 percent in month 12) are caused by factors other than randomness.
Using the data in Table 8.8, what is the average percentage of infections?
Explanation Verified
Calculating the average percen...
Managing for Quality and Performance Excellence 9th Edition by James Evans,William Lindsay
Why don’t you like this exercise?
Other Minimum 8 character and maximum 255 character
Character 255


