Essay
Using the scale below, draw the 1H NMR spectrum for isobutyl acetate, shown below. Present the peaks with correct splitting patterns and at the approximate chemical shift (+/- 0.5 ppm). Just above each peak, indicate the relative integration value of each type of hydrogen. 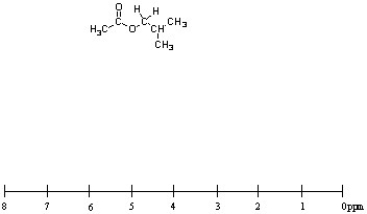
Correct Answer:

Verified
δ 3.9 ppm (d, 2H), 2...View Answer
Unlock this answer now
Get Access to more Verified Answers free of charge
Correct Answer:
Verified
View Answer
Unlock this answer now
Get Access to more Verified Answers free of charge
Q66: How many peaks appear in the proton
Q67: Deduce the identity of the following compound
Q68: Draw the <sup>1</sup>H NMR spectrum for the
Q69: Which carbon signal shows up in the
Q70: Deduce the identity of the following compound
Q72: Calculate the magnetic field that corresponds to
Q73: Deduce the identity of the following compound
Q74: What <sup>1</sup>H NMR spectral data is expected
Q75: How many peaks appear in the proton
Q76: Draw the <sup>13</sup>C NMR spectrum for the