Multiple Choice
Exhibit 10-14 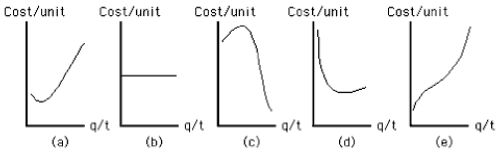
-Which of the curves shown in Exhibit 10-14 best represents the long-run average cost curve for an oligopolist?
A) Curve a
B) Curve b
C) Curve c
D) Curve d
E) Curve e
Correct Answer:

Verified
Correct Answer:
Verified
Q7: Exhibit 10-18 <img src="https://d2lvgg3v3hfg70.cloudfront.net/TB4915/.jpg" alt="Exhibit 10-18
Q25: The incentives for oligopolists to cheat on
Q26: In both monopolistic competition and non-price-discriminating monopoly,<br>A)the
Q36: There are multiple models of pricing behavior
Q40: Something is called a barrier to entry
Q94: Which of the following describes the relationship
Q120: Two heavy equipment manufacturers might collude in
Q128: In the long run, the output of
Q139: Economies of scale yield<br>A)declining average cost as
Q150: In which of the following market structures