Multiple Choice
Exhibit 6-29 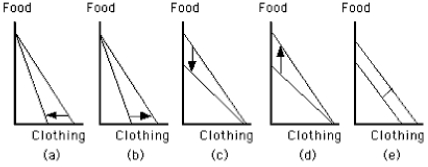
-Which graph in Exhibit 6-29 shows the effect of an increase in the price of clothing, other things constant?
A) Graph a
B) Graph b
C) Graph c
D) Graph d
E) Graph e
Correct Answer:

Verified
Correct Answer:
Verified
Q17: A consumer allocates income between clams and
Q35: Indifference curves in a consumer's indifference map
Q47: The slope of a budget line equals
Q56: All combinations of Pepsi and coffee that
Q66: What would happen if the price of
Q71: All combinations of goods along the same
Q94: This morning, Yoriko Dazai learned that the
Q95: <img src="https://d2lvgg3v3hfg70.cloudfront.net/TB4915/.jpg" alt=" -Point e in
Q100: A consumer allocates income between clams and
Q101: Exhibit 6-29 <img src="https://d2lvgg3v3hfg70.cloudfront.net/TB4915/.jpg" alt="Exhibit 6-29