Multiple Choice
Exhibit 6-29 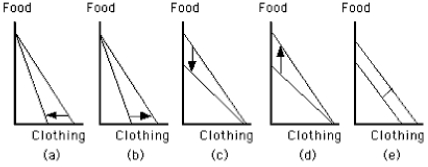
-Which graph in Exhibit 6-29 shows an increase in the price of food?
A) Graph a
B) Graph b
C) Graph c
D) Graph d
E) Graph e
Correct Answer:

Verified
Correct Answer:
Verified
Related Questions
Q12: Exhibit 6-30 <img src="https://d2lvgg3v3hfg70.cloudfront.net/TB4915/.jpg" alt="Exhibit 6-30
Q13: Exhibit 6-24 <img src="https://d2lvgg3v3hfg70.cloudfront.net/TB4915/.jpg" alt="Exhibit 6-24
Q15: If a consumer allocates income between goods
Q37: The slope of a budget line with
Q40: For inferior goods, a rise in price
Q42: The slope of an indifference curve is
Q83: People change their consumption choices in response
Q88: Although some of the statements below are
Q90: A candy bar sells for 50 cents,
Q98: If a good is inferior, an increase