Multiple Choice
Exhibit 5-17 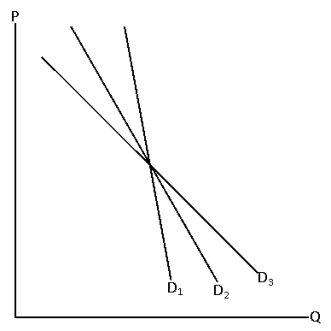
-Consider Exhibit 5-17. Demand curves D1, D2 and D3 represent the demand for food, apples and fruit. Which represents which?
A) D1 is apples, D2 is fruit and D3 is food
B) D1 is fruit, D2 is food and D3 is apples
C) D1 is food, D2 is apples and D3 is food
D) D1 is food, D2 is fruit and D3 is apples
E) impossible to tell without more information
Correct Answer:

Verified
Correct Answer:
Verified
Q3: All of the following are examples of
Q20: The price elasticity of demand helps determine
Q79: If the demand for a product is
Q87: If the demand for ptyalin is unit
Q99: Which of the following tends to make
Q129: Exhibit 5-27 <img src="https://d2lvgg3v3hfg70.cloudfront.net/TB4915/.jpg" alt="Exhibit 5-27
Q137: Exhibit 5-7 <img src="https://d2lvgg3v3hfg70.cloudfront.net/TB4915/.jpg" alt="Exhibit 5-7
Q160: If an increase in the price of
Q177: If the price of Pepsi-Cola increases from
Q215: Price elasticity of demand is defined as<br>A)the