Multiple Choice
Exhibit 5-27 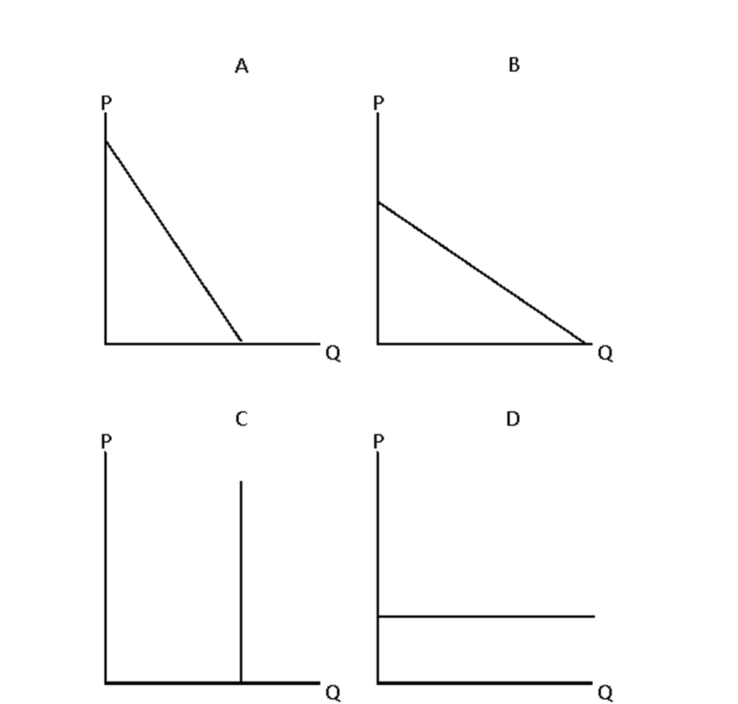
-Consider Exhibit 5-27. Which graph depicts a unitary elastic demand?
A) Graph A
B) Graph B
C) Graph C
D) Graph D
E) none of the graphs depicts a unitary elastic demand
Correct Answer:

Verified
Correct Answer:
Verified
Q12: Exhibit 5-13 <img src="https://d2lvgg3v3hfg70.cloudfront.net/TB4915/.jpg" alt="Exhibit 5-13
Q16: Exhibit 5-16 <img src="https://d2lvgg3v3hfg70.cloudfront.net/TB4915/.jpg" alt="Exhibit 5-16
Q72: If a 5% increase in price leads
Q96: Which of the following describes a situation
Q112: Total revenue is the same for every
Q139: Along a downward-sloping linear demand curve,<br>A)slope is
Q157: As price decreases along a linear demand
Q162: Goods with an income elasticity of demand
Q170: It has been suggested that if NHL
Q224: If the cross-price elasticity of demand is