Multiple Choice
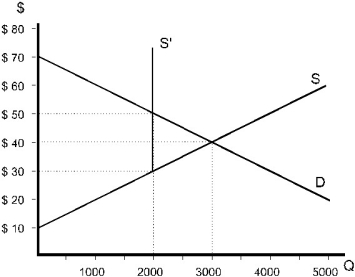
 Figure 9.7
-Refer to Figure 9.7. After the policy was implemented, the quantity traded became
A) 1000.
B) 2000.
C) 3000.
D) 4000.
E) between 2000 and 4000, but the amount depends upon producers' reactions, which are uncertain.
Correct Answer:

Verified
Correct Answer:
Verified
Q1: <img src="https://d2lvgg3v3hfg70.cloudfront.net/TB2894/.jpg" alt=" Figure 9.2 -Refer
Q2: <img src="https://d2lvgg3v3hfg70.cloudfront.net/TB2894/.jpg" alt=" Figure 9.6 -Refer
Q5: The world price for oil is $31
Q6: <img src="https://d2lvgg3v3hfg70.cloudfront.net/TB2894/.jpg" alt=" Figure 9.9 -Refer
Q8: Which of the following policies could lead
Q11: The market demand and supply functions for
Q53: The total and marginal cost functions for
Q64: A situation in which the unregulated competitive
Q121: What is the difference between a price
Q124: The utilities commission in a city is