Multiple Choice
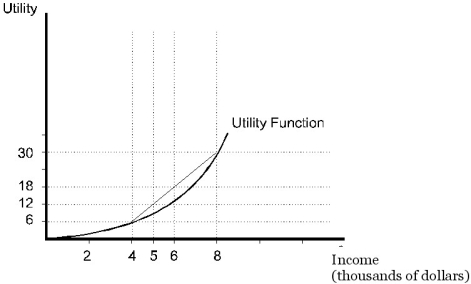 Figure 5.3
-The individual pictured in Figure 5.3
A) prefers a sure $6000 to a 50% chance of $4000 and a 50% chance of $8000.
B) has an expected utility of 12 from a 50% chance of $4000 and a 50% chance of $8000.
C) would receive a utility of 12 from a sure $6000.
D) would receive a utility of 18 from a sure $6000.
Correct Answer:

Verified
Correct Answer:
Verified
Q23: Behavioral economists argue that asset price bubbles
Q23: Scenario 5.5:<br>Engineers at Jalopy Automotive have discovered
Q24: Which of the following statements is NOT
Q30: Scenario 5.9:<br>Torrid Texts, a risk-neutral new firm
Q56: The information in the table below describes
Q89: The variance of an investment opportunity:<br>A) cannot
Q97: Dante has two possible routes to travel
Q108: Because of the relationship between an asset's
Q130: Scenario 5.3:<br>Wanting to invest in the computer
Q138: Suppose an investor equally allocates their wealth