Essay
The diagram below depicts the change in optimal consumption bundles for Marty when the price of shotgun shells fall. Decompose the change into the income and substitution effects. 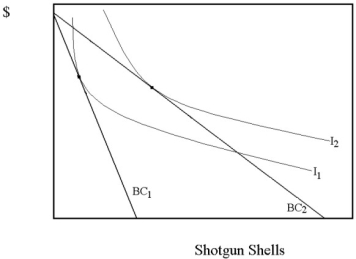
Correct Answer:

Verified
Correct Answer:
Verified
Related Questions
Q46: What is the shape of the marginal
Q48: Good A is a normal good. The
Q49: If an Engel curve has a negative
Q50: Suppose the marginal rate of substitution is
Q52: In a recent article, two economists estimated
Q53: The following data pertain to products A
Q54: Use the following statements to answer this
Q55: The point price elasticity of demand for
Q56: In closing down a military base, environmental
Q66: Sally Henin has a price elasticity of