Essay
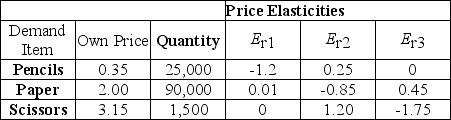
The following table gives the current price, quantity, and price elasticities of the linear demand curves for pencils, paper and scissors. The columns Erc under the Price Elasticities heading are calculated as Erc = ( 
) 
. The terms r and c refer to the row of the table and the column under the price elasticities heading, respectively. For example, if r is one and c is two, the value E12 is the responsiveness of pencil demand to changes in the paper price (i.e., a cross-price elasticity). The demand curves for each good are in the form Qr = ar + brP1 + crP2 + drP3 . Using the information in the table, derive the demand curve for each good.
Correct Answer:

Verified
Using the information in the table allow...View Answer
Unlock this answer now
Get Access to more Verified Answers free of charge
Correct Answer:
Verified
View Answer
Unlock this answer now
Get Access to more Verified Answers free of charge
Q40: Luxury brands like designer sun glasses are
Q81: Scenario 4.1:<br>Daniel derives utility from only two
Q127: Which of the following pairs of goods
Q128: Which of the following demand functions represents
Q129: Consider a particular market-clearing price and quantity
Q131: Suppose the market demand curve for cable
Q134: Scenario 4.2:<br>Suppose that the demand for artichokes
Q135: Use the following two statements in answering
Q136: When the bandwagon effect exists, a change
Q137: Scenario 4.5:<br>The demand curve for grilled cheese