Essay
Suppose the table below lists the price and consumption levels of food and clothing during 1990 and 2000. Calculate a Laspeyres and Paasche index using 1990 as the base year. 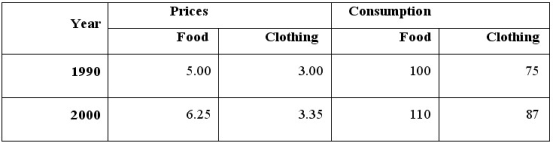
Correct Answer:

Verified
The Laspeyres Index is calcula...View Answer
Unlock this answer now
Get Access to more Verified Answers free of charge
Correct Answer:
Verified
View Answer
Unlock this answer now
Get Access to more Verified Answers free of charge
Q37: Which of the following statements about the
Q47: Suppose your utility function for food (F)
Q67: If a consumer must spend her entire
Q71: The Laspeyres price index tends to _
Q87: Draw a set of indifference curves for
Q89: An island economy produces only two goods,
Q93: A curve that represents all combinations of
Q94: Consider the following three market baskets:<br><img src="https://d2lvgg3v3hfg70.cloudfront.net/TB2894/.jpg"
Q99: A team of researchers has conducted a
Q107: <img src="https://d2lvgg3v3hfg70.cloudfront.net/TB3095/.jpg" alt=" Figure 3.2.3 -Suppose