Multiple Choice
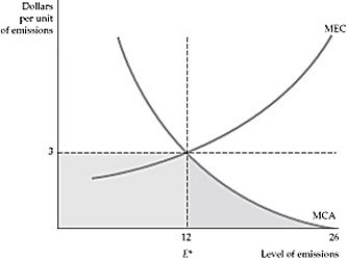 Figure 18.2.2
-If the MSB/MCA graph indicates that an emissions fee of $10 per unit would lead to the optimum level of emissions, but the government set a fee of $5 per unit, emissions would:
A) not be reduced at all.
B) not occur at all.
C) be above the optimum level, but curtailed somewhat from what they would have been with no fee at all.
D) be above the optimum level by 50%.
E) be below the optimum level by 50%.
Correct Answer:

Verified
Correct Answer:
Verified
Q6: The city of Econoville currently charges a
Q7: Scenario 18.1:<br>It is the factory's choice whether
Q8: Having a refundable deposit for recyclable material:<br>A)
Q9: <img src="https://d2lvgg3v3hfg70.cloudfront.net/TB3095/.jpg" alt=" Figure 18.2.1 -Refer
Q10: Visitors to National Parks cause damage and
Q12: The presence of pollution in the trucking
Q13: Because trucking as an industry involves the
Q14: To enforce the optimum level of emissions
Q15: Access to the movie "Casablanca," showing in
Q16: Under a transferable emissions permit system,<br>A) the