Essay
Refer to the following two diagrams to answer this question. 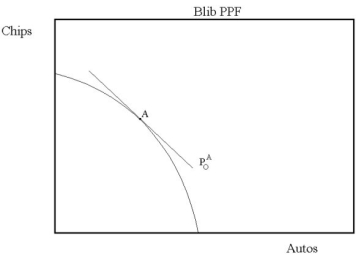
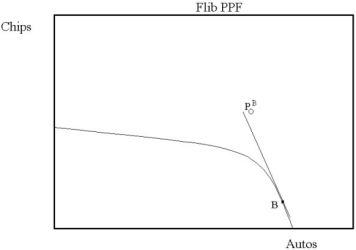 The production possibilities frontier for Autos and Chips are given above for the two countries Blib and Flib. Initially, there is no trade between Blib and Flib. As a result, Blib is maximizing societal welfare by producing and consuming at point A. Flib is maximizing societal welfare by producing and consuming at point B. The ratio of prices in Blib is given by line
  while the ratio of prices in Flib is given by line
  What is true about the relative price of Autos in Blib versus Flib? Explain how it may be possible for both countries to be made better off by trading Autos for Chips.
Correct Answer:

Verified
The price ratio line  is steeper than T...
View Answer
Unlock this answer now
Get Access to more Verified Answers free of charge
Correct Answer:
Verified
View Answer
Unlock this answer now
Get Access to more Verified Answers free of charge
Q68: Use the following statements to answer this
Q69: Suppose MRS is not the same across
Q70: The following table summarizes the production relationships
Q71: Figure 16.4.1<br>-A competitive equilibrium is efficient in
Q72: Why is the production possibilities frontier concave
Q74: Suppose there are 10 apples and 10
Q75: <img src="https://d2lvgg3v3hfg70.cloudfront.net/TB3095/.jpg" alt=" Figure 16.2.2 -Which
Q76: General equilibrium analysis is different from partial
Q77: Imagine a primitive society in which there
Q78: Scenario 16.1:<br>Irrespective of the amount of cheese