Essay
Refer to the diagram below to answer this question. 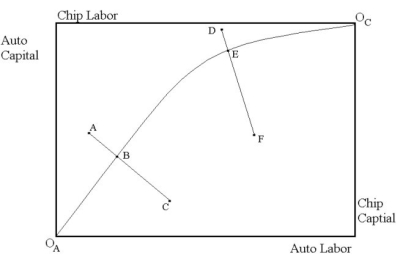 The Edgeworth Box diagram above refers to input usage in the automobile industry and the computer chip industry. The contract curve is given by
 . All points on this curve correspond to input prices being equivalent across industries. For example, the line segment AC indicates the input price ratio at point B in the two industries. Also, line segment DF indicates the input price ratio at point E in the two industries. The diagram below presents the production possibilities frontier for automobiles and computer chips.
 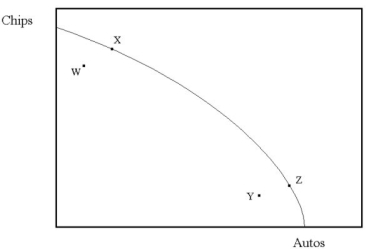 The labeled points in the production possibilities frontier diagram correspond to the points A, B, E, and F in the Edgeworth Box diagram above. Which points in the production possibilities frontier diagram correspond to which points in the Edgeworth Box diagram? Why?
Correct Answer:

Verified
Point A must correspond to point W. We k...View Answer
Unlock this answer now
Get Access to more Verified Answers free of charge
Correct Answer:
Verified
View Answer
Unlock this answer now
Get Access to more Verified Answers free of charge
Q91: Which of the following is true? Partial
Q92: Refer to the diagram below to answer
Q93: Use the following statements to answer this
Q94: Refer to the diagram below to answer
Q95: For an individual consumer, a corner solution
Q97: Use the following statements to answer this
Q98: Canada produces MP3 players and lumber, and
Q99: Two individuals, A and B, are free
Q100: Two individuals, Dave and Bob, consume two
Q101: All points within the production possibilities frontier