Multiple Choice
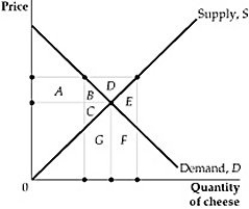 Figure 9.4.1
-Refer to Figure 9.4.1 above. Suppose the government raises the price of cheese above the market equilibrium level (P0) by imposing a high minimum price and purchasing all of the excess supply from the market, and these quantities are destroyed. Based on the areas in the figure below, what is the change in producer surplus after this policy is adopted?
A) Producers lose area C but gain area A.
B) Producers lose area C but gain area A+B.
C) Producers gain A.
D) Producers gain area A+B+D.
Correct Answer:

Verified
Correct Answer:
Verified
Q93: The market for semiskilled labor can be
Q94: <img src="https://d2lvgg3v3hfg70.cloudfront.net/TB3095/.jpg" alt=" Figure 9.4.2 -Refer
Q95: <img src="https://d2lvgg3v3hfg70.cloudfront.net/TB3095/.jpg" alt=" Figure 9.5.1 -Refer
Q96: <img src="https://d2lvgg3v3hfg70.cloudfront.net/TB3095/.jpg" alt=" Figure 9.2.1 -Refer
Q97: As noted in the text, the major
Q99: <img src="https://d2lvgg3v3hfg70.cloudfront.net/TB3095/.jpg" alt=" Figure 9.1.1 -Refer
Q100: The market demand and supply functions for
Q101: Suppose a competitive market is in equilibrium
Q102: Price ceilings can result in a net
Q103: The elected officials in a west coast