Multiple Choice
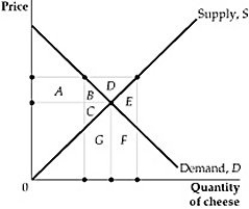 Figure 9.4.1
-Refer to Figure 9.4.1 above. Suppose the government raises the price of cheese above the market equilibrium level (P0) by imposing a high minimum price and purchasing all of the excess supply from the market, and these quantities are destroyed. Based on the areas in the figure below, what is the cost of this program to the government?
A) Government expenditures are area E+F+G.
B) Government expenditures are area B+C+D.
C) Government expenditures are area D.
D) Government expenditures are area B+C+D+E+F+G.
Correct Answer:

Verified
Correct Answer:
Verified
Q22: <img src="https://d2lvgg3v3hfg70.cloudfront.net/TB3095/.jpg" alt=" Figure 9.5.2 -Refer
Q23: The consumer's gain from the imposition of
Q24: Suppose the market supply curve is upward
Q25: <img src="https://d2lvgg3v3hfg70.cloudfront.net/TB3095/.jpg" alt=" Figure 9.2.1 -Refer
Q26: <img src="https://d2lvgg3v3hfg70.cloudfront.net/TB3095/.jpg" alt=" Figure 9.5.1 -Refer
Q28: <img src="https://d2lvgg3v3hfg70.cloudfront.net/TB3095/.jpg" alt=" Figure 9.5.2 -Refer
Q29: A specific tax will be imposed on
Q30: When the federal government installs a price
Q31: <img src="https://d2lvgg3v3hfg70.cloudfront.net/TB3095/.jpg" alt=" Figure 9.5.2 -Refer
Q32: <img src="https://d2lvgg3v3hfg70.cloudfront.net/TB3095/.jpg" alt=" Figure 9.1.3 -Refer