Multiple Choice
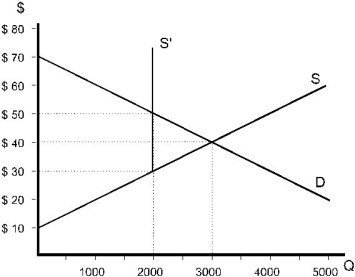 Figure 9.4.3
-Refer to Figure 9.4.3 above. After the policy, consumer surplus became:
A) $0.
B) $10.
C) $20.
D) $20,000.
E) $40,000.
Correct Answer:

Verified
Correct Answer:
Verified
Q2: <img src="https://d2lvgg3v3hfg70.cloudfront.net/TB3095/.jpg" alt=" Figure 9.1.3 -Refer
Q3: <img src="https://d2lvgg3v3hfg70.cloudfront.net/TB3095/.jpg" alt=" Figure 9.1.3 -Refer
Q4: Under a binding price ceiling, what does
Q5: The price elasticity of demand is -1.5.
Q6: Where Es is the elasticity of supply
Q8: <img src="https://d2lvgg3v3hfg70.cloudfront.net/TB3095/.jpg" alt=" Figure 9.4.3 -Refer
Q9: <img src="https://d2lvgg3v3hfg70.cloudfront.net/TB3095/.jpg" alt=" Figure 9.5.2 -Refer
Q10: The market demand and supply functions for
Q11: <img src="https://d2lvgg3v3hfg70.cloudfront.net/TB3095/.jpg" alt=" Figure 9.1.1 -Refer
Q12: Although rice is a staple of the