Multiple Choice
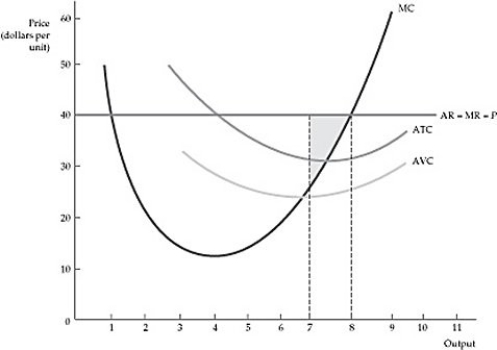 Figure 8.4.1
-Refer to Figure 8.4.1 above. The shaded area in the graph shows:
A) the increase in profit when output is reduced from 8 to 7 units of output.
B) the profit that could be made if output increases from 7 to 8 units of output.
C) the deadweight loss associated with the power of the price taking firm.
D) the amount of profit when 8 units of output are produced.
Correct Answer:

Verified
Correct Answer:
Verified
Q124: <img src="https://d2lvgg3v3hfg70.cloudfront.net/TB3095/.jpg" alt=" Figure 8.4.2 -Refer
Q125: Suppose a plant manager ignores some implicit
Q126: Suppose your firm has a U-shaped average
Q127: <img src="https://d2lvgg3v3hfg70.cloudfront.net/TB3095/.jpg" alt=" Figure 8.8.1 -Refer
Q128: The market for wheat consists of 500
Q130: The market demand for a type of
Q131: <img src="https://d2lvgg3v3hfg70.cloudfront.net/TB3095/.jpg" alt=" Figure 8.7.3 -Refer
Q132: That Table 8.1 shows a short-run situation
Q133: The demand for pizzas in the local
Q134: The "perfect information" assumption of perfect competition