Multiple Choice
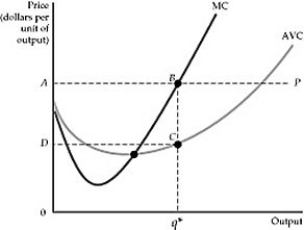 Figure 8.6.2
-Refer to Figure 8.6.2 above. Which area represents producer surplus in this figure?
A) ABCD
B) 0DCq*
C) The area inside the MC curve and the AVC curve
D) The area above the MC curve and below the price level, P
Correct Answer:

Verified
Correct Answer:
Verified
Q13: <img src="https://d2lvgg3v3hfg70.cloudfront.net/TB3095/.jpg" alt=" Figure 8.7.3 -Refer
Q14: The perfectly competitive firm's marginal revenue curve
Q15: Which of the following cases are examples
Q16: Suppose the market demand curve is perfectly
Q17: If current output is less than the
Q19: In an increasing-cost industry, expansion of output:<br>A)
Q20: If current output is less than the
Q21: The demand curve facing a perfectly competitive
Q22: At the profit-maximizing level of output, marginal
Q23: If a competitive firm has a U-shaped