Multiple Choice
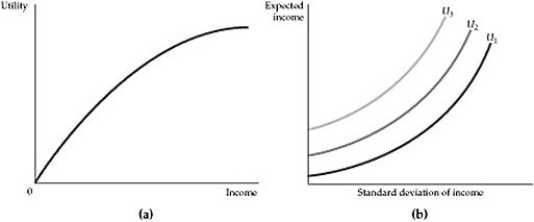 Figure 5.2.1
-Refer to Figure 5.2.1 above. Because risk is undesirable, the greater the amount of risk, the greater the expected income needed to make the individual equally well off. Which of the two graphs best describes this assertion?
A) The figure in panel (a)
B) The figure in panel (b)
C) Both figures
D) Neither figure
Correct Answer:

Verified
Correct Answer:
Verified
Q41: <img src="https://d2lvgg3v3hfg70.cloudfront.net/TB3095/.jpg" alt=" Figure 5.2.3 -The
Q42: What would best explain why a generally
Q43: What is the advantage of the standard
Q44: Scenario 5.10:<br>Hillary can invest her family savings
Q45: Richard is a stock market day trader.
Q47: Table 5.4<br> <img src="https://d2lvgg3v3hfg70.cloudfront.net/TB3095/.jpg" alt="Table 5.4
Q48: Mary is a fervent Iowa State University
Q49: Assume that one of two possible outcomes
Q50: Scenario 5.5:<br>Engineers at Jalopy Automotive have discovered
Q51: Smith just bought a house for $250,000.