Multiple Choice
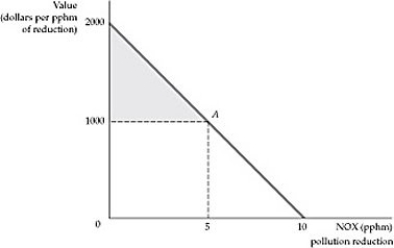 Figure 4.4.4
-Refer to Figure 4.4.4 above. A demand for clean air, like the one in the figure is:
A) the actual demand in the market for tradable permits to pollute.
B) a demand derived from the differences in the willingness to pay for housing in cleaner or dirtier cities.
C) a demand approximately like the one estimated by the Environmental Protection Agency in the United States.
D) only a hypothetical demand.
Correct Answer:

Verified
Correct Answer:
Verified
Q114: When demand is elastic, an increase in
Q115: A positive network externality associated with a
Q116: An Engel curve:<br>A) slopes upward for normal
Q117: <img src="https://d2lvgg3v3hfg70.cloudfront.net/TB3095/.jpg" alt=" Figure 4.3.1 -Refer
Q118: The aggregate demand for good X is
Q120: The aggregate demand for good X is
Q121: <img src="https://d2lvgg3v3hfg70.cloudfront.net/TB3095/.jpg" alt=" Figure 4.1.3 -Refer
Q122: The table below lists the demand curve
Q123: <img src="https://d2lvgg3v3hfg70.cloudfront.net/TB3095/.jpg" alt=" Figure 4.1.3 -Refer
Q124: The advantage of an isoelastic demand curve