menu-iconExamlexExamLexServices

Discover

Ask a Question
  1. All Topics
  2. Topic
    Business
  3. Study Set
    Microeconomics Study Set 23
  4. Exam
    Exam 3: Consumer Behavior
  5. Question
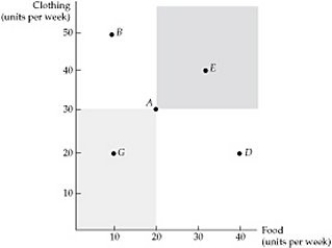
    Figure 3.1.1 -A Curve That Represents All Combinations of Market Baskets That
Solved

Figure 3.1.1 -A Curve That Represents All Combinations of Market Baskets That

Question 96

Question 96

Multiple Choice

  Figure 3.1.1 -A curve that represents all combinations of market baskets that provide the same level of utility to a consumer is called: A)  a budget line. B)  an isoquant. C)  an indifference curve. D)  a demand curve. Figure 3.1.1
-A curve that represents all combinations of market baskets that provide the same level of utility to a consumer is called:


A) a budget line.
B) an isoquant.
C) an indifference curve.
D) a demand curve.

Correct Answer:

verifed

Verified

Unlock this answer now
Get Access to more Verified Answers free of charge

Related Questions

Q91: Jane is attempting to maximize utility by

Q92: Which of the following statements is not

Q93: Which price index tends to understate the

Q94: If the quantity of good A (Q<sub>A</sub>)

Q95: You may consume ice cream or frozen

Q97: <img src="https://d2lvgg3v3hfg70.cloudfront.net/TB3095/.jpg" alt=" Figure 3.1.8 -Refer

Q98: Scenario 3.1:<br>Andy derives utility from two goods,

Q99: A team of researchers has conducted a

Q100: Sue views hot dogs and hot dog

Q101: <img src="https://d2lvgg3v3hfg70.cloudfront.net/TB3095/.jpg" alt=" Figure 3.2.3 -Refer

Examlex

ExamLex

About UsContact UsPerks CenterHomeschoolingTest Prep

Work With Us

Campus RepresentativeInfluencers

Links

FaqPricingChrome Extension

Download The App

Get App StoreGet Google Play

Policies

Privacy PolicyTerms of ServiceHonor CodeCommunity Guidelines

Scan To Download

qr-code

Copyright © (2025) ExamLex LLC.

Privacy PolicyTerms Of ServiceHonor CodeCommunity Guidelines