Multiple Choice
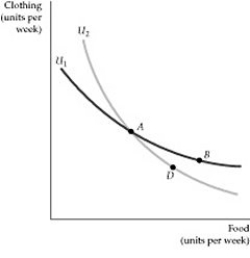 Figure 3.1.3
-Refer to Figure 3.1.3 above. The way in which the indifference curves are drawn in this figure:
A) represents a unique case in which two different indifference curves offer the same level of utility.
B) compares three market baskets that yield the same level of utility.
C) violates the principle of transitivity in the model of consumer behavior.
D) represents the usual way in which indifference curves appear on an indifference map.
Correct Answer:

Verified
Correct Answer:
Verified
Q7: The following table presents Mary's marginal utility
Q8: Oscar consumes only two goods, X and
Q9: When a person consumes two goods (A
Q10: Suppose that the price of gasoline has
Q11: The local farmer's market sells corn for
Q13: <img src="https://d2lvgg3v3hfg70.cloudfront.net/TB3095/.jpg" alt=" Figure 3.1.4 -Refer
Q14: The ideal cost-of-living index represents:<br>A) the cost
Q15: The food stamp program provides low income
Q16: Consider the following three market baskets:Table 3.1<br>
Q17: The principle of revealed preference would say