Multiple Choice
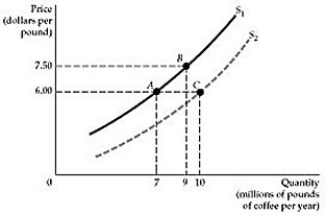 Figure 2.1.1
-Refer to Figure 2.1.1 above. Starting from point A, how do the firms in the market react when the price of coffee increases from $6.00 to $7.50 per pound?
A) The supply curve shifts to the right and the quantity supplied increases to 10 million pounds per year.
B) The supply curve shifts from S1 to S2, but the market moves from A to B, so the quantity supplied increases to 9 million pounds per year.
C) The market moves from A to B temporarily, but eventually will settle at point C, where the quantity supplied will be 10 million pounds.
D) The supply curve does not shift, but the quantity supplied increases from 7 to 9 million pounds per year.
Correct Answer:

Verified
Correct Answer:
Verified
Q75: <img src="https://d2lvgg3v3hfg70.cloudfront.net/TB3095/.jpg" alt=" Figure 2.2.1 -Refer
Q76: <img src="https://d2lvgg3v3hfg70.cloudfront.net/TB3095/.jpg" alt=" Figure 2.3.2 -Figure
Q77: <img src="https://d2lvgg3v3hfg70.cloudfront.net/TB3095/.jpg" alt=" Figure 2.5.5 -Refer
Q78: If the actual price were below the
Q79: When the government controls the price of
Q81: The discussion of Figure 2.2 in the
Q82: From 1970 to 2017, the real price
Q83: <img src="https://d2lvgg3v3hfg70.cloudfront.net/TB3095/.jpg" alt=" Figure 2.6.1 -Refer
Q84: Rare earth metals are used to manufacture
Q85: Which of the following would cause a