Multiple Choice
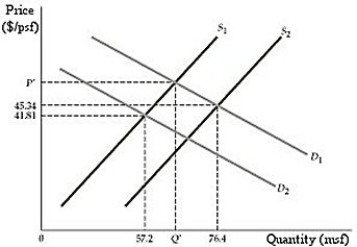 Figure 2.3.1
-Refer to Figure 2.3.1. In Example 2.4, the textbook describes the impact of 9/11 on the real estate market in New York city. How does the sketch in figure 2.3.1 adapt to the described scenario?
A) Demand shifted from D1 to D2 and supply shifted from S1 to S2.
B) Demand shifted from D1 to D2 and supply shifted from S2 to S1.
C) Demand shifted from D2 to D1 and supply shifted from S1 to S2.
D) Demand shifted from D2 to D1 and supply shifted from S2 to S1.
Correct Answer:

Verified
Correct Answer:
Verified
Q29: <img src="https://d2lvgg3v3hfg70.cloudfront.net/TB3095/.jpg" alt=" Figure 2.5.3 -Refer
Q30: From 1970 to 2017, the real price
Q31: Elasticity measures:<br>A) the slope of a demand
Q32: <img src="https://d2lvgg3v3hfg70.cloudfront.net/TB3095/.jpg" alt=" Figure 2.7.1 -Refer
Q33: Historically, investors have considered gold commodities to
Q35: <img src="https://d2lvgg3v3hfg70.cloudfront.net/TB3095/.jpg" alt=" Figure 2.4.1 -Refer
Q36: Suppose there is currently a surplus of
Q37: <img src="https://d2lvgg3v3hfg70.cloudfront.net/TB3095/.jpg" alt=" Figure 2.6.2 -Refer
Q38: Suppose that the short-run world demand and
Q39: Which of the following would shift the