Multiple Choice
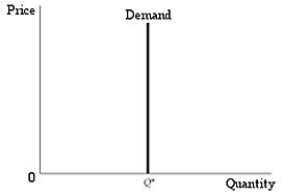 Figure 2.4.3
-Refer to Figure 2.4.3 above. Which of the following best describes de demand curve in this figure?
A) Demand is infinitely elastic.
B) Demand is completely inelastic.
C) Demand becomes more inelastic the lower the price.
D) Demand becomes more elastic the lower the price.
Correct Answer:

Verified
Correct Answer:
Verified
Q126: Suppose the supply of coal is perfectly
Q127: The demand for a bushel of wheat
Q128: The currency used by the Confederate States
Q129: According to the textbook, for most goods
Q130: Along any downward-sloping straight-line demand curve:<br>A) both
Q132: <img src="https://d2lvgg3v3hfg70.cloudfront.net/TB3095/.jpg" alt=" Figure 2.5.4 -The
Q133: <img src="https://d2lvgg3v3hfg70.cloudfront.net/TB3095/.jpg" alt=" Figure 2.4.1 -Refer
Q134: <img src="https://d2lvgg3v3hfg70.cloudfront.net/TB3095/.jpg" alt=" Figure 2.4.3 -Refer
Q135: Suppose the market price for wheat changes,
Q136: Which of the following represents the price