Multiple Choice
The figure given below represents the decision tree of an operations head of a facility who considers a new production technique.ER represents his expected return (in thousand $) from the new technique.If he does not adopt the technique his expected return would be zero.The probabilities of the technique being a success or a failure are 0.7 and 0.3 respectively.Compute the expected return (in thousand $) from the adoption of the new production technique. 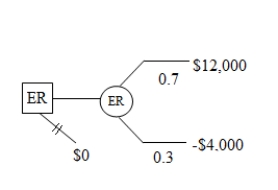
A) $10,000
B) $1,000
C) -$2,000
D) $7,200
E) $8,600
Correct Answer:

Verified
Correct Answer:
Verified
Q4: Apply the expected-value criterion to choose between
Q14: Define probability with an example.
Q27: A firm supplies aircraft engines to the
Q29: The probability of an outcome:<br>A)ranges between zero
Q30: A financial analyst considers three funds.The funds'
Q31: An individual is said to risk averse
Q33: The term expected value is defined as:<br>A)the
Q35: An individual is uncertain whether to bet
Q37: A manager who chooses among options by
Q47: A firm is thinking about introducing a